
Identifying Psychophysiological Correlates of Boredom
and Negative Mood Induced During HCI
Dimitris Giakoumis
1, 3
, Athanasios Vogiannou
1, 3
, Illka Kosunen
2
Kostantinos Moustakas
1
, Dimitrios Tzovaras
1
and George Hassapis
3
1
Centre for Research and Technology Hellas, Informatics and Telematics Institute
6th Km Charilaou-Thermi Road Rd., 57001, Thermi, Thessaloniki, Greece
2
Helsinki Institute for Information Technology, Pilotti Building
Metsδnneidonkuja 4, 02100 Espoo, Finland
3
Aristotle University of Thessaloniki
Department of Electrical and Computer Engineering, Greece
Abstract. This paper presents work conducted towards the automatic recogni-
tion of negative emotions like boredom and frustration, induced due to the sub-
ject’s loss of interest during HCI. Focus was on the basic pre-requisite for the
future development of systems utilizing an “affective loop”, namely effective
recognition of the human affective state. Based on the concept of “repetition
that causes loss of interest”, an experiment for the monitoring and analysis of
biosignals during repetitive HCI tasks was deployed. During this experiment,
subjects were asked to play a simple labyrinth-based 3D video game repeated-
ly, while biosignals from different modalities were monitored. Twenty one dif-
ferent subjects participated in the experiment, allowing for a rich biosignals da-
tabase to be populated. Statistically significant correlations were identified be-
tween features extracted from two of the modalities used in the experiment
(ECG and GSR) and the actual affective state of the subjects.
1 Introduction
The development of automatic affect recognition systems based on biosignals has
attracted much attention recently. The Jamesian theory [1] emphasizes the importance
of peripheral signals in affect recognition, as it suggests there are specific patterns of
physiology that relate to different emotions. During the last years, several important
attempts have been made towards this direction; e.g. [2], [3], [4], [5], [6], [7], under-
lining the usefulness of peripheral activity for emotion assessment in diverse condi-
tions.
The potential development of future game-playing systems which, based on an af-
fective loop [8], will be able to adapt on the basis of the player’s emotions seems very
interesting. Such systems will be able to identify whether the player is getting bored
of the game and then adapt the playing context accordingly, in order to draw her/his
attention again and induce more positive emotions. The first step towards this direc-
Giakoumis D., Vogiannou A., Kosunen I., Moustakas K., Tzovaras D. and Hassapis G. (2010).
Identifying Psychophysiological Correlates of Boredom and Negative Mood Induced During HCI.
In Proceedings of the 1st International Workshop on Bio-inspired Human-Machine Interfaces and Healthcare Applications, pages 3-12
DOI: 10.5220/0002812600030012
Copyright
c
SciTePress
tion is the development of appropriate classifiers, able to effectively identify the us-
er’s affective state of boredom, induced while playing. Previous work [9] has already
shown that playing simple games like Tetris at different levels of difficulty gives rise
to different emotional states that can be defined as boredom, engagement and anxiety.
That specific work aimed at the automatic recognition of the player’s state of bore-
dom from biosignal features; the desired emotional states were induced by playing
Tetris game versions of different difficulty.
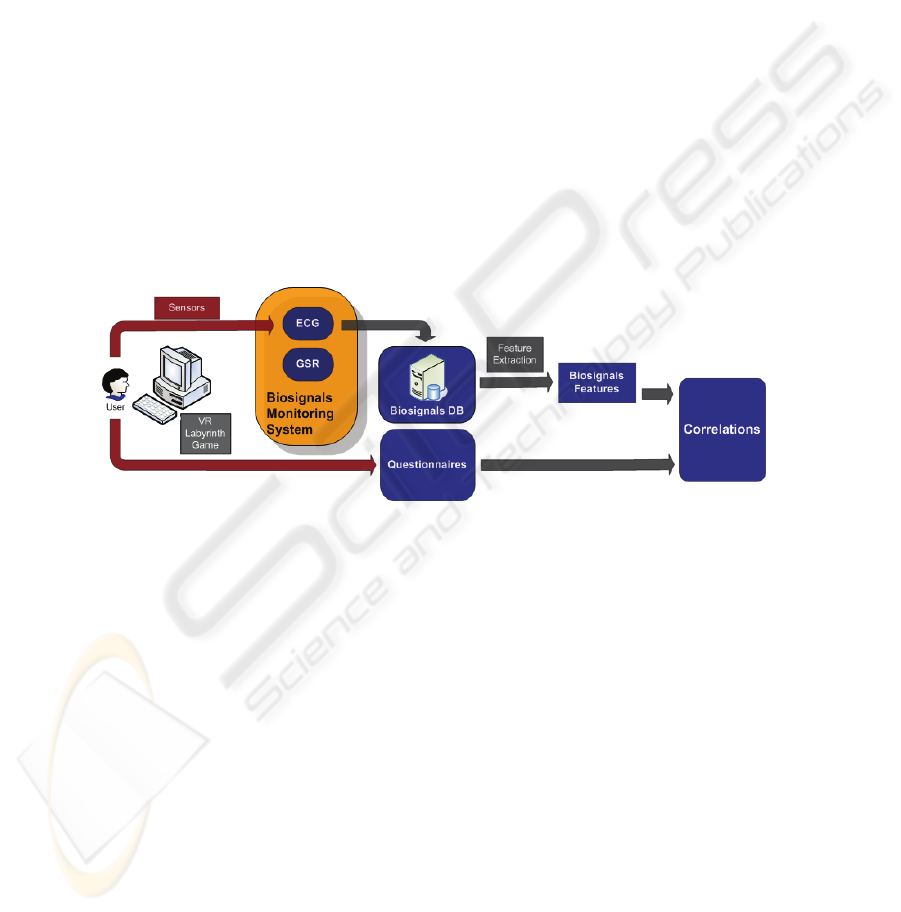
Moving towards more typical game-playing scenarios, in this work we focus on
the identification of the most appropriate biosignal features to use for the effective
classification of negative emotions like boredom and frustration, during playing typi-
cal 3D video-games. For this purpose, we have examined a set of features extracted
from various biosignal modalities monitored during a negative emotion-induction
experiment, based on repetitive playing of a 3D Labyrinth game. The aim of this
analysis (Fig. 1) was to identify correlations between the extracted biosignal features
and the actual affective state of the player, as the latter changed during the experi-
mental session. For the purpose of the experiment, data was collected from four dif-
ferent biosignal modalities (EEG, ECG, GSR and EMG). However, since the data
analysis is a work in progress, in this paper we focus on the two modalities that have
until now produced the most significant correlations to the ground truth data, namely
ECG and GSR.
Fig. 1. Overview of Experiment and Data Analysis presented in this paper.
In the following of this paper, the monitoring framework’s background is provided
in Section 2, followed by the description of the methods used for feature extraction
regarding each modality (Section 3). The experiment conducted for data collection is
presented in Section 4. Finally, Section 5 presents statistically significant results from
the analysis of the data collected, followed by conclusions, presented in Section 6.
2 Monitoring Framework Background
In this work, Electrocardiogram was used in order to assess the subject’s Heart Rate
Variability (HRV). HRV describes the variations between consecutive heartbeats.
The regulation mechanisms of HRV originate from the sympathetic and parasympa-
thetic nervous systems and thus HRV can be used as a quantitative marker of the
autonomic nervous system’s operation [10]. Features extracted from ECG, reflecting
4

the subject’s HRV have already been used together with features derived from other
modalities in a number of studies targeting automatic emotion recognition e.g. [3],
[4], [5], [6], [11]. Most commonly used HRV analysis methods are based on the time
and frequency domains [12].
Time-domain HRV parameters are the simplest ones, calculated directly from the
RR interval (or Inter-Beat Intervals) time series. These are the time series produced
from the time intervals between the consecutive “R-peaks” of the raw ECG signal.
The simplest time domain measures are the Mean and Standard Deviation of the IBIs.
Commonly used HRV features are also the RMS of the IBI Sequential Differences
(RMSSD) and the percentage within a time period of sequential differences that are
over 50 milliseconds (pNN50). These features provide additional information about
large-amplitude beat-to-beat changes in HR. In the frequency-domain analysis, power
spectral density (PSD) of the IBI series is usually calculated. The commonly used
frequency bands for HRV are Very Low Frequency (VLF, 0-0.04 Hz), Low Frequen-
cy (LF, 0.04-0.15 Hz), and High Frequency (HF, 0.15-0.4 Hz). The most common
frequency-domain HRV features include the powers of VLF, LF, and HF bands and
the LF to HF ratio.
Galvanic Skin Response (GSR), also referred to as Electrodermal activity (EDA),
is a measure of skin conductance, which can be seen as an indirect measure of sympa-
thetic nervous system activity [13]. The outer level of skin is highly resistive while
the deeper layers of skin are highly conductive. These levels are “connected” by
sweat glands, that when opened, create a pathway from the surface of the skin to the
deeper, conductive level of the skin [14]. There are two main types of fluctuations of
EDA that occur with stimulation: the momentary phasic responses and the more sta-
ble tonic level. Both phasic and tonic GSR features are commonly used towards au-
tomatic affect recognition [2], [3], [4], [5], [6], [11], [15]. GSR features commonly
extracted and used in the literature are the Mean level of the GSR signal and the skin
conductivity startle responses (Skin Conductance Response - SCR). SCRs are distinc-
tive short waveforms (for a description see [4]) found inside the GSR signal that
signify responses to internal or external stimuli.
3 Feature Extraction
In an effort to identify the best features to use for the development of proper classifi-
ers regarding our specific application scenario, various features were extracted from
the recorded signals and analyzed. The features used in the present analysis were
checked for robustness to potential noise that could appear in the recorded signals.
Regarding the ECG modality, we considered the extraction of features from the
subject’s Inter Beat Intervals (IBI) time series. ECG data were collected at a sampling
rate of 256 Hz. Inter-Beat Intervals were calculated from the subject’s recorded Elec-
trocardiogram, directly by our monitoring device’s (Procomp5) software. Prior to
feature extraction, IBI artifacts were removed by a filter excluding IBIs over 1200
and under 500 ms. This filtering was applied in order to exclude IBI values which
could not be normal, given our specific application scenario. Thresholds were set at
5

the values 500 and 1200 ms since an IBI outside this range would mean that the sub-
ject suddenly had a Heart Rate over 120 or under 50 beats/minute respectively.
Table 1. Features extracted from the Inter Beat Intervals time series of the ECG modality.
Feature Name Formula Description
IBI Mean per trial
∑
=
=
n
i
imean
ibi
n
ibi
1
1
n = number of IBIs during the trial
The average duration
of the Inter-Beat
Intervals during each
trial
IBI SD per trial
∑
=
−=
n
i
meaniSD
ibiibi
n
ibi
1
2
)(
1
The Inter Beat Inter-
vals Standard Devia-
tion during a trial
IBI LF/HF per Trial
∑
∑
=
=
=
n
i
i
n
i
i
LHm
hfp
lfp
ibi
1
1
lfp
i
= Low Frequency band power
hfp
i
= High Frequency band power
The average ratio of
the Low Frequency
band power to the
High Frequency band
power during a trial
IBI RMSSD
∑
=
+
−=
n
i
iiSD
ibiibi
n
ibi
1
2
1
)(
1
0)(
1
≠
−
∀
+ ii
ibiibi
RMS of the sequen-
tial differences of the
IBI calculated for the
whole trial
IBI pNN50
nd
nd
ibi
pNN
50
50
>
=
nd
>50
= number of sequential IBI differ-
ences that are over 50 ms within a trial
nd = total number of sequential differences
during the trial
Percentage of the
number of sequential
IBI differences that
are over 50 ms
The time-domain (TD) and frequency-domain (FD) features shown in Table 1 were
extracted from the IBI time series:
Regarding the GSR modality, we examined both the tonic and phasic electrodermal
activity. The following features were extracted from the recorded GSR signals, sam-
pled at a rate of 256 Hz:
The average value of the GSR signal during each trial (feature GSR Mean per Tri-
al) was calculated with the formula:
∑
=
=
n
i
imean
gsr
n
gsr
1
1
Where n = Total number of GSR samples during the trial
(1)
For the extraction of features related to the phasic electrodermal activity the sub-
ject’s Skin Conductance Responses (SCRs) during each trial were identified. Due to
6

the fact that the majority of trials were about half minute long, only the first twenty
five seconds of each trial were taken into account for the identification of SCR occur-
rences. Initially, the 1st derivative of the GSR signal values was calculated:
ii
ii
i
tt
gsrgsr
rawdgsr
−
−
=
+
+
1
1
1_
.
Where gsr
i
= Value of the
th
i GSR sample, t
i
= Timestamp of the
th
i GSR sample
(2)
The resulting time-series was convoluted with a 255-point Bartlett window. As a
result, the time series of the smoothed GSR 1st derivative values,
gsr_d1 was produced.
Similarly to the procedure applied in [4], the occurrence of an SCR was detected by
finding two consecutive zero crossings, from negative to positive and from positive to
negative within the time series of the GSR smoothed first derivative (
gsr_d1). The
maximum amplitude of the detected SCR was obtained by finding the maximum
value of the actual GSR signal between these two zero-crossings. Detected SCRs with
maximum amplitude smaller than the 10% of the maximum SCR amplitude detected
within each trial were excluded. After all SCRs were identified, together with their
maximum amplitude and duration, the features Number of SCRs, Average Ampli-
tude of SCRs and Average Duration of SCRs were calculated for the first 25
seconds of each trial. The average value of the smoothed GSR first derivative (
gsr_d1)
per trial was also extracted as feature (GSR 1st Derivative).
In order to perform proper group analysis, between-subject normalization was ap-
plied to the data collected from the ECG and GSR modalities, following two different
normalization methods: The first method (N1) produced the ratio of each feature to its
value obtained from the rest period of the specific subject. The second method (N2)
was based on the transformation of each sample into a percentage of the span for that
particular signal, similarly to the procedure applied in [16]: For each signal (GSR and
IBI), a global minimum (x
min
) and maximum (x
max
) were obtained for each participant
using all game playing trials, and the same global values were used for normalizing
each sample of the specific signal within each trial with the formula:
minmax
min
2
)(
)(
xx
xix
ix
N
−
−
=
.
Where x = Samples of the GSR or IBI signals, x
N2
= Normalized samples of the GS
R
or IBI signals
(3)
4 Experimental Setup
The aim of the experiment was to monitor the subject’s biosignals while the state of
boredom due to loss of interest was induced from a repetitive HCI task, namely the
repetitive playing of the same 3D Labyrinth game. The subject’s actual affective state
during the experimental session was assessed with the use of questionnaires, filled in
after each trial.
7

4.1 Stimuli
A basic 3D labyrinth game (Fig. 2) was developed for the purpose of the experiment.
In order to complete the game, the players had simply to find the exit. The player
could walk through the mazy corridors of the labyrinth using a 3D first person camera
which is controlled by the WASD/Arrow keys and the mouse, a standard method
used in commercial games. The game was developed in C++ using OGRE
(http://www.ogre3d.org/) for graphics and the “Bullet” physics library
(http://www.bulletphysics.com) for physics simulation. The tests were performed on a
Laptop PC with an Intel Core 2 Duo T7700@2.40GHz CPU, 2 GBs of RAM and a
NVIDIA GeForce 8600M GT graphics card. The game ran steadily on a 60 frame/sec
rate.
Fig. 2. Screenshot of the VR Labyrinth game.
In order to induce drowsiness due to loss of interest effectively, the Labyrinth was
designed to be a very simple one. Furthermore, in all repetitions the player started
from the same point and the Labyrinth exit was always at the same place. Usually,
after the third or fourth trial, the subject had learnt the shortest path to the exit. Thus,
even though in the beginning (first two trials), the game was kind of exciting, as soon
as the subject had learned the shortest path to the exit, the stimuli became an absolute-
ly repetitive HCI task, ideal to induce negative emotions (e.g. boredom) due to loss of
interest.
4.2 Hardware Setup
Both ECG and GSR biosignals were recorded using a Procomp5 Infiniti device (Fig.
3b). One three-electrode ECG sensor was placed at the subject’s forearms, or in cases
that the subject had very low cardiac pressure, on its chest (Fig. 3a). Autoadhesive
Ag/AgCl bipolar surface electrodes (bandwidth 10-500 Hz, pickup surface 0.8 cm2,
inter-electrode distance 2 cm) were used for the ECG signal acquisition. Furthermore,
one two-electrode GSR sensor placed at the subject’s left hand ring and small fingers
(Fig 3c). The synchronization of the measurements and the VR Labyrinth game was
based on a custom-made application, using the Network Time Protocol (NTP).
8

(a) (b) (c)
Fig. 3. Experimental Setup: (a) ECG sensors, (b) the Biosignals Monitoring Device and (c)
GSR sensors.
4.3 Participants and Procedure
The experiment was performed with twenty one subjects chosen among the partici-
pants of the eNTERFACE'09 summer workshop held in Genova, Italy. All partici-
pants frequently used computers in their work and were between 23 and 44 years old
with 48 percent of them being 25 and 26 years old, 14 were males and 7 females.
Forty two percent of the subjects were already familiar with 3D maze games but only
nineteen percent of them played this type of game frequently (more than one hour per
week). Trials from four different subjects were excluded from data analysis due to
artifacts.
Initially, the subjects were asked to sign a consent form. After that, the sensors
were installed, while the subject answered questions regarding personal details and
previous gaming experience in the pre-questionnaire. At this point, the proper sensor
placement was ensured, by checking carefully the robustness of the signal delivered
from each monitoring modality. The recorded signals were checked on line for arti-
facts due to external noise or mechanical causes (e.g subject’s motion). The prepara-
tion was renewed when severe artifacts were observed.
Once the sensors were properly placed, the subject was asked to relax with eyes-
closed for one minute in order for the signal to stabilize and calibration data to be
recorded (rest period). After the end of the rest period, the VR Labyrinth game was
presented to the subject. From this point, the subject would play the Labyrinth game
repeatedly. Each experimental session constituted of at least ten trials. Each trial
started when the subject started playing the Labyrinth game and stopped as soon as
the subject had found the exit, or a 10 minute time-limit had expired. Trials usually
lasted from half to eight minutes. A mid-trial relaxation period of one minute was
assigned between each trial. During this period, subjects had to fill in the mid-trials
questionnaire. Using a Likert scale ranging from 1 to 5, they had to answer whether
they would like to play the Labyrinth game again, whether they felt frustrated or
bored of it and whether they were concentrated during the trial or focused on external
events and/or personal thoughts. The experiment continued until the subjects had
9

played a minimum of ten trials and had signaled drowsiness/boredom in the question-
naire at least two times in a row. At the end of the experiment, subjects were asked to
fill in a post-questionnaire, which was used for the assessment of their overall level of
immersion during the entire experiment. Additional stages were also included in the
experimental protocol; however these did not interfere with the induction of boredom
and are outside the scope of the data analysis presented in this paper.
5 Results
In order to identify correlations between biosignal features and the subject’s actual
affective state, we followed an analysis based on the Kendall’s tau correlation coeffi-
cient. In particular, the correlation between the subject’s Likert-scaled answers to
specific questions of the mid-trial questionnaires, and each of the features extracted
from the biosignals was calculated. Significance level was set at p=0.05 (*) and
p=0.01(**). Questions considered in this analysis assessed the player’s tendency to
stop playing the game (Q1), frustration (Q2) and boredom (Q3). Furthermore, we
considered two more questions, assessing factors of the player’s affective state which
can be thought opposite to boredom, like the player’s level of immersion/flow (Q4)
and concentration (Q5). Several statistically significant correlations were identified
and are summarized in Table 2.
Table 2. Statistically significant correlations of Features extracted from the ECG and GSR
modalities (N=Number of cases).
Question Feature Correlation (Kendall’s tau)
Q1
(Play again)
IBI Mean per trial (N2)
τ
=-0.284** p<0.001 N=221
Number of SCRs per trial
τ= 0.133* p=0.014 N=221
Q2
(Frustration)
IBI Mean per trial (N2)
τ= 0.120* p=0.019 N=221
IBI LF/HF per Trial (N1)
τ= 0.104* p=0.042 N=221
GSR Mean per trial (N2)
τ= 0.193** p<0.001 N=221
Q3
(Boredom)
IBI Mean per trial (N2)
τ
= 0.258** p<0.001 N=221
IBI RMSSD per trial (N1)
τ
=-0.103* p=0.040 N=221
Number of SCRs per trial
τ=-0.199** p<0.001 N=221
GSR 1st Derivative per trial
τ=-0.166** P<0.001 N=221
Q4
(Flow / Immer-
sion)
IBI SD per trial (N1)
τ= 0.209** p<0.001 N=221
IBI LF/HF per Trial (N1)
τ= 0.100* p=0.045 N=221
IBI RMSSD per trial (N1)
τ
= 0.165** p=0.001 N=221
IBI pNN50 per trial (N1)
τ= 0.104* p=0.048 N=199
Q5
(Concentration)
IBI Mean per trial (N2)
τ=-0.176** p=0.001 N=187
IBI SD per trial (N1)
τ= 0.155** p=0.004 N=187
IBI RMSSD per trial (N1)
τ= 0.125*
p
=0.020 N=187
Frustration (Q2), boredom (Q3) and a tendency to stop playing the game (Q1 in-
versed) were found to correlate positively to the IBI Mean per trial feature. This indi-
10

cates a tendency of the subject’s Heart Rate to decrease, when a negative mood is
induced from the interaction. Furthermore, frustration was also found to correlate to
the LF to HF Average Ratio per trial and the Average value of the subject’s GSR
signal per trial (
τ= 0.193, p<0.001). These features are indicative of the subject’s
sympathetic nervous system activation and thus, her/his overall level of arousal,
which is expected to increase with frustration. Boredom was found to correlate nega-
tively to the subject’s number of SCRs per trial (
τ=-0.199, p<0.001), in accordance to
the fact that increased numbers of SCRs are connected to higher levels of arousal.
Furthermore, boredom was also found to correlate negatively to the average value of
the GSR first derivative per trial (
τ=-0.166, p<0.001).
Regarding the questions assessing factors opposed to boredom, flow and immer-
sion was found to positively correlate to the IBI Standard Deviation, LF to HF Aver-
age Ratio, RMSSD and pNN50, features connected to higher levels of immersion and
arousal. Finally, concentration correlated positively to the subject’s Heart Rate (In-
verse of IBI Mean), and negatively to the IBI Standard Deviation and RMS of Se-
quential Differences. The GSR Mean per trial feature correlated negatively (
τ=-0.203,
p<0.001) to the subject’s concentration level.
Summarizing, several features extracted from ECG and GSR biosignals were found
to correlate significantly to the subject’s actual affective state during the experimental
session. These identified correlations could be used in the future as a guide for effec-
tive feature selection towards automatic emotion recognition, although the Kendall
correlation coefficient did not reach very high values (up to ~0.25) in general. The
EEG and EMG modalities used in the experiment have not produced equally signifi-
cant results until now; however we strongly believe that more sophisticated pre-
processing, analysis and fusion of all monitored modalities can lead to better results
in the future.
6 Conclusions
This work presents a biosignals-based experiment, which focused on the identifica-
tion of psychophysiological correlates of the changes in the user’s affective state
during repetitive tasks in HCI. Data was collected from 21 subjects who played the
same video game repeatedly, while their EEG, EMG, ECG and GSR signals were
recorded. Various features were extracted from the biosignals and examined with the
aim to identify statistically significant correlations between them and various Likert-
scaled questions assessing the player’s affective state. The analysis was based on the
Kendall’s tau correlation coefficient.
Various features extracted from ECG and GSR biosignal modalities were analyzed,
so as to identify significant ones that could be used in the future for the automatic
classification of negative emotions and mood, induced during 3D video-game play-
ing. This work is planned to continue working towards the development of classifiers
for the effective recognition of boredom, induced due to the player’s loss of interest.
The major future goal is the development of a real-time monitoring framework for
affective state classification, towards the realization of Human-Machine Interfaces
based on affective loops.
11

References
1. Cornelius, R.R., 1996. The Science of Emotion. Prentice-Hall, Upper Saddle River, NJ
2. Picard, R. W., Vyzas, E., and Healey, J. (2001). Toward machine emotional intelligence:
Analysis of affective physiological state. IEEE Transactions on Pattern Analysis and Ma-
chine Intelligence, 23(10),1175-1191
3. Kim, J. and Andr´e, E. (2008). Emotion recognition based on physiological changes in
music listening. IEEE Transactions on Pattern Analysis Machine Intelligence,
30(12):2067–2083
4. K. H. Kim, S. W. Bang, and S. R. Kim, "Emotion recognition system using short-term
monitoring of physiological signals" Medical & Biological Engineering & Computing, vol.
42, pp. 419-427, May 2004
5. Wagner, J.,Kim, J.,Andre´, E. , 2005. From physiological signals to emotions: implement-
ing and comparing selected methods for features extraction and classification. In: IEEE In-
ternational Conference on Multimedia & Expo
6. Haag, A., Goronzy, S., Schaich, P., Williams, J., 2004. Emotion recognition using bio-
sensors: first step toward an automatic system. In: Affective Dialog Systems: Tutorial and
Research Workshop, Kloster Irsee, Germany
7. M. Benovoy, J. R. Cooperstock, and J. Deitcher. Biosignals analysis and its application in a
performance setting - towards the development of an emotional-imaging generator. In P.
Encarnação and A. Veloso, editors, BIOSIGNALS (1), pages 253–258. INSTICC, 2008
8. Sundström, P. (2005), Exploring the Affective Loop, PhD thesis, Stockholm University
9. Chanel, G.,Rebetez,C.,Be´trancourt, M.,Pun,T.,2008. Boredom, engagement and anxiety as
indicators for adaptation to difficulty in games. In: 12
th
International Mind Trek Confe-
rence: Entertainment and Media in the Ubiquitous Era. ACM, Tampere, Finland
10. Task force of the European society of cardiology and the North American society of pacing
and electrophysiology. Heart rate variability – standards of measurement, physiological in-
terpretation, and clinical use. Circulation, 93(5):1043–1065, March 1996
11. Rainville, P., Bechara, A., Naqvi, N., Damasio, A.R., 2006. Basic emotions are associated
with distinct patterns of cardiorespiratory activity. International Journal of Psychophysiol-
ogy 61 (1), 5–18
12. G.G. Berntson, J.T. Bigger Jr., D.L. Eckberg, P. Grossman, P.G. Kaufmann, M. Malik,
H.N. Nagaraja, S.W. Porges, J.P. Saul, P.H. Stone, and M.W. Van Der Molen. Heart rate
variability: Origins, methods, and interpretive caveats. Psychophysiol, 34:623–648, 1997
13. Andreassi, J. L. (1995). Psychophysiology: human behavior and physiological response.
Hillsdale, N.J., Lawrence Erlbaum Associates
14. Schwartz, M. S. (1995). Biofeedback: A Practioner’s Guide. New York: Guilford Press
15. Chanel, G., Kronegg, J., Grandjean, D., Pun, T., 2006. Emotion assessment: arousal evalua-
tion using EEG’s and peripheral physiolo- gical signals. In: Gunsel, B., Tekalp, A.M., Jain,
A.K., Sankur, B. (Eds.), Multimedia Content Representation Classification and Security.
Springer Lecture Notes in Computer Sciences, vol. 4105, pp. 530–537.
16. Mandryk, R. L., & Atkins, M. S. (2007). A fuzzy physiological approach for continuously
modeling emotion during interaction with play technologies. International Journal of Hu-
man-Computer Studies, 65, 329-347
12
