
CLASSIFYING
WEB PAGES WITH VISUAL FEATURES
Viktor de Boer, Maarten van Someren
Informatics Institute, Universiteit van Amsterdam, Science Park 107, 1098 XG Amsterdam, The Netherlands
Tiberiu Lupascu
EURO IT&C B.V., Haarlem, The Netherlands
Keywords:
Web design, Computer vision, Image analysis, Machine learning.
Abstract:
To automatically classify and process web pages, current systems use the textual content of those pages,
including both the displayed content and the underlying (HTML) code. However, a very important feature of a
web page is its visual appearance. In this paper, we show that using generic visual features we can classify the
web pages for several different types of tasks. The features used in this document are simple color and edge
histograms, Gabor and texture features. These were extracted using an off-the-shelf visual feature extraction
method. In three experiments, we classify web pages by their aesthetic value, their recency and the type of
website. Results show that these simple, global visual features already produce good classification results. We
also introduce an online tool that uses the trained classifiers to assess new web pages.
1 INTRODUCTION
The ”Look and Feel” is an important property of a
website. Most research and development that is aimed
at analysis of websites focuses on the content, in par-
ticular on the words and their meanings. In addition
to the content the form of a webpage is used to convey
or even to induce emotional aspects. Individuals and
organizations attach much importance to the image
that is created by their presence on the web. A bank
should appear reliable, an artist creative, an IT com-
pany technically advanced and user friendly. Design-
ers use their creativity to find a form that conveys and
evokes emotion, trust, authority or a range of impres-
sions like creativity, innovation, political or environ-
mental awareness, religious background, etc. etc. In
this paper we describe preliminary experiments with
several dimensions of Look and Feel.
Look and feel can take many forms, as can eas-
ily be seen by reviewing for example home pages of
persons and organizations. In the design of a website
the visual appearance or look and feel is constructed
by colors and color combinations, type fonts, images
and videos, dimensions of page layout such as con-
trasts. Look and Feel is produced by designers in an
intuitive way, using design tools that enable manipu-
lation of visual elements.
Our goal is to enable automatic analysis of this vi-
sual appearance of web pages. This goal is part of
a wider effort to achieve automated analysis of web-
sites. In earlier studies methods and tools were devel-
oped that analyze websites by their content, in partic-
ular their vocabulary and structure. The practical goal
of this is to develop a tool that supports the design of
web-based information systems by constructing a first
draft of the information architecture or by critiquing a
first draft. This is done by modeling a given collection
of sites and comparing the model with the draft. The
first version of the tool only considered the content,
the way in which this is organized over pages and the
hyperlinks between pages (Hollink et al., 2009).
Our approach is based on using the page as it ap-
pears to the user. Analysis of documents on the web
is normally based on data that are extracted from the
HTML. This is the approach that is typically followed
for analyzing the content of web pages. The HTML
is removed and the natural language words are used
as properties of the page and used for classification
or extracting information (Ester et al., 2002; Kwon
and Lee, 2003, e.g.). For analysis of Look and Feel
this approach seems hardly feasible because Look and
Feel elements are difficult or impossible to identify in
the HTML code. Some systems allow selection of
Look and Feel elements in the form of color schemes
245
de Boer V., van Someren M. and Lupascu T.
CLASSIFYING WEB PAGES WITH VISUAL FEATURES.
DOI: 10.5220/0002804102450252
In Proceedings of the 6th International Conference on Web Information Systems and Technology (WEBIST 2010), page
ISBN: 978-989-674-025-2
Copyright
c
2010 by SCITEPRESS – Science and Technology Publications, Lda. All rights reserved

or the shape and layout of menus, buttons, etc. but
many designers construct their own layout, colors and
style for objects. For this reason we decided to use
low level features of a page, taken as an image. This
makes it independent of how the page is produced and
analyzes it directly in terms of how the user sees it.
In (Amento et al., 2000), the authors describe a
study into the perceived quality of web sites. The re-
sults show that the number of images on a web site is
one of the five features that has the highest correlation
with the quality of web sites as perceived by users.
Research into the perceived quality of web pages has
shown that the visual appearance of web pages is also
important for the perceived credibility (Fogg et al.,
2001).
In (Mandl, 2006) the author describes the
AQUAINT system, a quality based search engine.
The system uses 113 features to describe web pages,
which are extracted at runtime. Among these features
are also color features: notably the number of col-
ors, the number of unique colors, the RGB values of
most frequent color, the text color and the background
color. Other visual features include the number of
graphics on a page, the number of links to graphics,
the relation between the number of graphics and the
file size. These features are at least partially derived
from the underlying HTML. In our approach, we ex-
tract the visual features from the pages, as rendered
by a web browser. In the ACQUAINT system, the vi-
sual features were combined with other features (e.g.
textual content) to train a classifier that distinguishes
between high and low quality web pages. The relation
between the number of graphics and the file size was
among the most important distinguishing features.
Below we summarize our method for training
classifiers, the evaluation procedure and the results of
experiments with visual attributes of web pages.
2 VISUAL FEATURES
We use the Firefox web browser to render an image
for a web page. Of each page, we save a screen
shot using the Fireshot plugin
1
for the Firefox web
browser. These screen shots are stored as .PNG files.
2.1 Attributes of Pages
For each page a number of low-level features are
computed. For this, we use the Lire image feature
library for content-based image retrieval (Lux and
Chatzichristofis, 2008). This Java library offers a
1
http://screenshot-program.com/fireshot/
number of different feature extraction modules, in-
cluding MPEG-7 standard features. In this study we
used the following features:
Simple Color Histogram. The default RGB color
histogram. The histogram is produced by discretiza-
tion of the colors in the image into 32 of bins, and
counting the number of image pixels in each bin. A
bin corresponds to part of the color intensity spec-
trum. High frequencies in low bins indicate that the
image has a lot of dark colors. High values in the bins
with a higher number indicate images with more light
colors.
Edge Histogram. The MPEG-7 edge histogram
descriptor represents the spatial distribution of five
types of edges (four directional edges and one non-
directional) (Park et al., 2000). Specifically, the im-
age space is divided into 16 (4x4) non-overlapping
sub-images and for each sub-image a histogram with
five edge bins is generated. This results in a descriptor
with 80 attributes.
Tamura Features. In (Tamura et al., 1978) the au-
thors propose a number of features of texture that they
claim to correspond to human visual perception. The
Tamura module in Lire extracts the features describ-
ing the coarseness, contrast and directionality of an
image. The first two are represented by single values,
while directionality is split into 16 bins. This results
in a Tamura feature vector of 18 attributes.
Gabor Features. Gabor filters have been used
extensively as a model of texture for image interpre-
tation tasks. We here use the Gabor feature extraction
model as implemented in Lire. This results in 36
attributes.
For each pages this results in total of
(32+80+18+36=) 166 variables that characterize
the image of the page.
2.2 Feature Selection and Learning
The machine learning process consists of two steps.
The first is to select relevant features. This was done
using chi-square as a criterion. Attributes are ranked
based on their chi-square value. The top M attributes
are then selected, the rest are discarded. In this re-
search, we experimented with values 20, 15, 10, 5 and
1 for M. In the second step a classifier is constructed
using the Nave Bayes classifier and a decision tree
learning algorithm (J48). In both cases the default im-
plementations in the WEKA toolkit were used.
WEBIST 2010 - 6th International Conference on Web Information Systems and Technologies
246
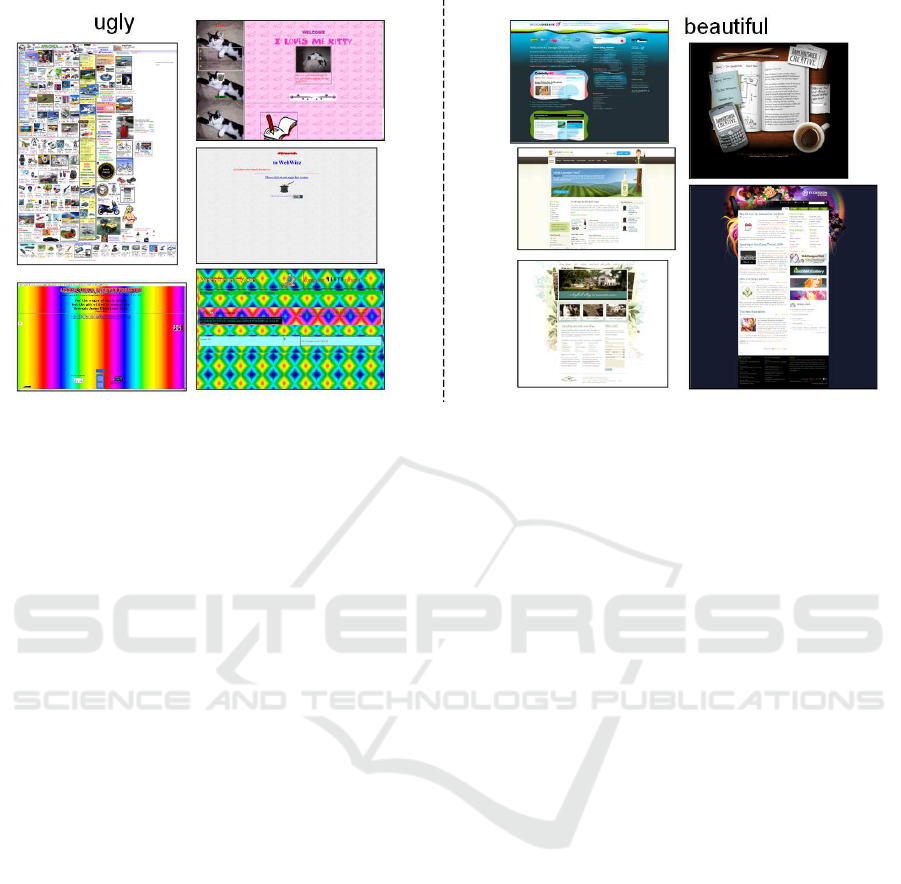
Figure 1: Example Screenshots of 5 ugly and 5 beautiful pages.
3 EVALUATION
METHODOLOGY
In this paper, we present the results of three different
web page classification experiments. These are two
binary classification tasks: on aesthetic value and on
recency. In the third experiment we classify the web
pages on the web site topic, this task uses four classes.
All comparisons used sets of 30 pages for each class.
Pages have different sizes and a page may not fit on
a single screen. In each case the complete page was
used.
To evaluate which features are the most predictive
for the different tasks, we evaluate the classification
accuracy with three feature vector subsets: the whole
feature vector (166 attributes), just the Simple Color
Histogram, just the Edge Histogram and the subset
indicated by the feature selection procedure. For the
latter, we present the results with the highest accuracy
for each experiment.
The results were evaluated using 10-fold cross-
validation. For each cross validation experiment we
report the mean accuracy over the 10 runs and the fea-
tures that were selected.
4 EXPERIMENT 1: AESTHETIC
VALUE
In the first experiment, we define two classes: that
of ugly web pages and beautiful web pages. With our
notion of Aesthetic Value, we only consider the visual
design of a web page. This does not need to reflect the
quality of the information, the usefulness or the pop-
ularity of a page. Neither do the classes represent the
quality of the interaction of information design of a
page. This classification is of course quite subjective.
We decided to use pages on which most people would
agree that they are beautiful or ugly, which results in
pages that have rather extreme position on this dimen-
sion.
4.1 The Data
For the ugly pages, we downloaded 30 pages listed
in the article ”The World’s Ugliest Websites” from
a popular design weblog (Andrade, 2009). The web
pages were listed either in the article or in the com-
ment section of this article. An informal opinion poll
resulted in unanimous agreement with this classifica-
tion. Among these are the use of color, animated gif’s,
tiled backgrounds or a cluttered page design. Figure
1 shows screenshots of a number of these ugly web
pages.
For the beautiful pages, we also consulted a de-
sign web log, listing the author’s selection of the most
beautiful web pages of 2008 (Crazyleafdesign.com,
2009). From this list, we retrieved 30 web pages. In-
spection of these pages shows that they include many
web designers home pages. The web pages feature a
lot of visual design, many colors, pictures and Adobe
Flash elements. In that sense they differ from a more
minimalistic design that popular web sites use. Fig-
ure 1 shows screenshots of a number of these ugly and
beautiful web pages.
We note that pages from both categories use a lot
CLASSIFYING WEB PAGES WITH VISUAL FEATURES
247

of color, both include pages with many visual ele-
ments. It appears that the beautiful web sites make
more use of softer color schemes and edges, while in
the ugly pages, the colors are brighter and the edges
are sharper.
4.2 Results
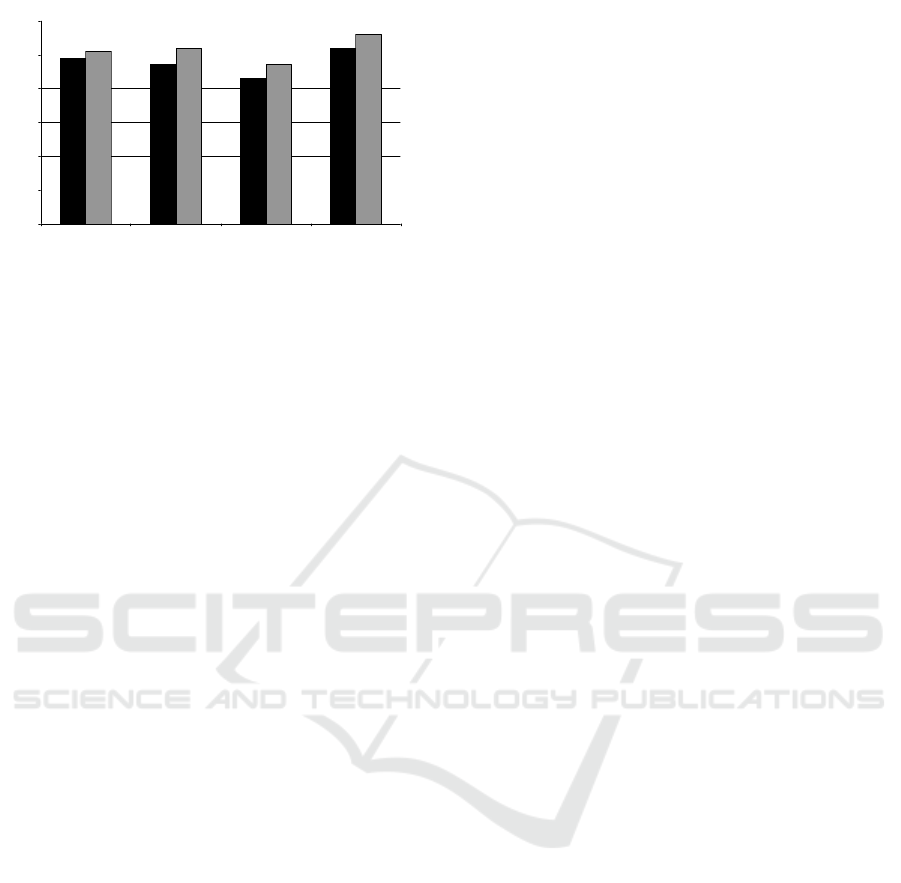
The results are shown in Figure 2. The Naive Bayes
Classifier, trained on all features predicted the class
for 41 web pages correctly, while the trained J48
decision tree classifier predicted 48 pages correctly,
resulting in accuracy of 68% and 80% respectively,
which is well over chance level. To evaluate the in-
fluence of the two basic features, Simple Color His-
togram and Edge Histogram, we trained the model
with these two subsets individually. For the Sim-
ple Color Histogram subset, this resulted in models
that correctly classified 41 (Naive Bayes) and 40 (J48
tree) pages correctly. For Edge Histogram, 42 (Naive
Bayes) and 32 (J48 tree) pages were classified cor-
rectly.
We applied feature selection, as explained in Sec-
tion 2.2. All the selected features are either from
the Simple Color Histogram or the Edge Histogram.
The best predicting features are the 74th Edge His-
togram attribute. A high value for this attribute in-
dicates that there are many non-directional edges in
the bottom-right of the image. Ugly web sites have
relatively more of these non-directional edges in this
sub-image. Other selected features include the Sim-
ple Color Histogram attributes 22-25. High values in
these bins indicate that a website has a higher prob-
ability of being ’beautiful’. These high values corre-
spond to images with relatively light colors. Analysis
of the data showed that instances from both classes
have high values in the extreme bins (1 and 80, in-
dicating the use of black and white respectively), but
that beautiful pages use more colors that are in be-
tween these extremes.
We again trained the model using the top 20, 15,
10, 5 and the top 1 ranked attributes. Of these, the
best result was obtained when the top 5 attributes are
used and those results are also shown in Figure 2. The
best results are obtained when the J48 decision tree is
used, trained on the top 5 attributes. Here 50 pages
are classified correctly, which corresponds to an ac-
curacy of 83%. The result for a classification based
on only one feature (in this case again the 74th Edge
Histogram attribute), produces relatively good results
(73% and 62% for Naive Bayes and J48 tree respec-
tively). The reduced number of features most likely
prevents the models from overfitting. Overall, the
results show a surprisingly high prediction accuracy
0
10
20
30
40
50
60
All Features Simple Color
Histogram
Edge Histogram Feature Selection
(top 5 attr)
Figure 2: Class prediction results for different feature sub-
sets for the ugly vs beautiful web pages task. The black bars
in the histogram show the number of correct classifications
by the Naive Bayes classifiers correct predictions and the
gray bars those of the j48 decision tree.
which can be achieved using only a few simple global
color and edge frequency features.
5 EXPERIMENT 2: RECENCY
For the second experiment, we look at old and new
pages. Web design has changed a lot over the years
and our visual classification method should be able to
identify old or new pages. While the aesthetic quality
of a web page is subjective, the time at which it was
created is not.
5.1 The Data
We extracted pages from 1999 and from 2009. For
the 1999 pages, we selected the 16 popular US web
sites of 1999. We also included 8 of the most popu-
lar Dutch and 6 of the most popular German sites of
the same year. We used the Internet Archive web site
(The Internet Archive Wayback Machine, 2009) to re-
trieve the 1999 versions of the web pages. We made
sure that the web page was fully loaded and displayed
all visual elements. The most popular pages of 2009
were selected using the Alexa.com web page popular-
ity rankings
2
. Even though the look and feel of most
web pages changes a lot over ten years, the modern
versions often still resemble the old versions. The fi-
nal set of 30 2009 web pages consisted of 15 top US
pages, 9 Dutch and 6 German web pages.
Inspection of the screenshots of the 60 web pages
shows that there is indeed a difference in visual ap-
pearance between the two classes. The older web
pages in general seem to have fewer colors than the
2
www.alexa.com
WEBIST 2010 - 6th International Conference on Web Information Systems and Technologies
248
0
10
20
30
40
50
60
All Features Simple Color Histogram Edge Histogram Feature Selection
(top 10 attr)
Figure 3: Class prediction results for the new vs. old pages
task. The black bars in the histogram show the number of
Naive Bayes classifiers correct predictions, the gray bars
that of the j48 decision tree.
new web pages. Hyperlinks in old pages are gen-
erally blue and underlined, while hyperlinks in new
pages have arbitrary colors. Because of technical lim-
itations, older pages generally contain few images and
video thumbnails compared to newer pages, which is
also visible in the visual appearance.
5.2 The Results
Figure 3 show the results of this experiment. Using
the complete feature vector, the Naive Bayes and J48
classifiers predict the correct class for 49 and 51 web
pages, resulting in accuracies of 82% and 85% respec-
tively. This is again well above chance level. This
indicates that this classification can also be learned
by using simple visual features. When only the color
histogram subset of the attributes is used, the Naive
Bayes classifier performed slightly less than the base-
line and the J48 tree slightly better. Using only edge
information, both models performed slightly worse
than the baseline, but still with a accuracy of 72%
(Naive Bayes) and 78% (J48).
Feature selection showed that the best predicting
features for this problem were again the use of lighter,
non-extreme colors: Simple Color Histogram bins 21-
29. A higher value in these bins indicates a higher
probability of a web page being ’new’. This corre-
sponds to an increased use of both digital photographs
on web sites and tot the intuition that advancements
in both display monitor capabilities and web design
tools will cause newer web pages to employ a wider
color spectrum. Tamura directionality features are
also among the selected features. On average, the
newer web pages have higher scores in the Tamura
directionality bins, more specifically in directionality
bins 7-13. These bins correspond to the frequencies of
diagonal, slanted edges of which there are more in the
newer web pages. This difference can be explained
by the increased use of graphics and photographs on
web pages.
Using a subset of 10 feature-selected attributes re-
sulted in the best predicting models: The average ac-
curacy over 10 cross-validation runs was 87% and
93% for Naive Bayes and the Decision Tree respec-
tively. Using only the features of the Simple Color
Histogram gives more or less the same accuracy as
using all features. The same is true for features of the
edges. Using the entire feature set probably causes
overfitting and this removes the potential benefit of
using extra features. Here again the data represented
extreme cases rather than a representative sample and
average classifications will have lower accuracy.
6 EXPERIMENT 3: TOPIC
The third experiment involves classification on web
page topic. The topic of a web site is of course re-
flected first of all in its content and does not automat-
ically dictate the visual appearance. Numerous meth-
ods for classifying web pages by their verbal content
were developed and tested successfully. However, in
addition to their content, many topics have a charac-
teristic visual appearance. For example web design
blogs have a highly designed visual appearance them-
selves, while newspaper sites will have a lot of text
and images. The goal of this experiment is to see if
it is possible to classify web pages by topic based on
their visual appearance. A practical advantage of the
use of visual features is that they can be used indepen-
dent of the language. Although there is research that
shows how cultural differences are reflected in inter-
face and web design (Evers and Day, 1997), the visual
design of web pages from the same web site topic is
appears to be very much similar across different coun-
tries. To demonstrate this we included web pages in
different languages in our experiment.
6.1 The Data
We define four classes, corresponding to web site top-
ics. These classes are newspaper sites, hotel sites,
celebrity sites and conference sites. For each of these
classes we retrieved 30 homepages:
• For the newspaper class, we retrieved 30 home-
pages of well-known newspapers from the US,
UK, the Netherlands, Germany, France, Belgium,
Russia, Japan, India and China, all in their native
language.
• For the conference class, we retrieved the home-
pages of 30 of the highest ranked computer sci-
ence conferences.
CLASSIFYING WEB PAGES WITH VISUAL FEATURES
249
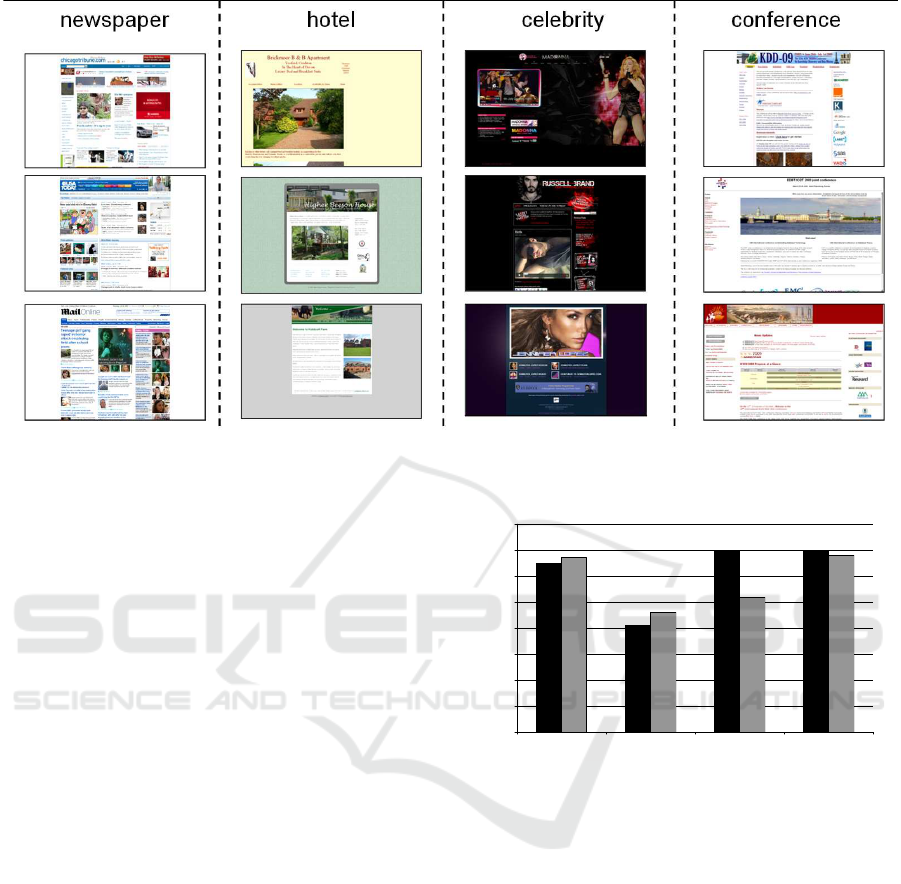
Figure 4: Screenshots of three web pages for each of the four web site topic classes. The example images shown here are
manually selected to be representative of the look and feel for those web site topics.
• The celebrity sites class consists of 30 web
pages for celebrities. For this we consulted the
Alexa.com popularity ranking of celebrity sites.
These included a number of fan sites. We ex-
cluded multiple sites from the same domain or
sites about the same celebrity.
• For the hotel class, we retrieved 30 home pages
from small British bed-and-breakfast businesses.
We here included only businesses with their own
domain, so that the visual design was determined
by that business.
Inspection of the pages suggests that there is in-
deed a difference in visual appearance of the sites:
newspaper homepages have a lot of text on a semi-
white background and some photographs. The con-
ference pages mainly conform to the ’three column’
design and have a clear, simple, two-color design with
one colorful banner on the top of the page. Celebrity
pages have a lot of visual design, images and video
thumbnails. The hotel sites often have a minimalistic
design, but do include photographs. Figure 4 shows
for each class three representative web pages.
6.2 Results
Figure 5 shows the classification results. When all
features are used, the Naive Bayes and J48 classifiers
predict the correct class for 65 and 67 web pages out
of 120, resulting in accuracy of 54% and 56% respec-
tively. This is a significant improvement over the 25%
prior probability of correct classifications. Using the
subset of Simple Color Histogram features results in
0
10
20
30
40
50
60
70
80
All Features Simple Color Histogram Edge Histogram Feature Selection
(top 10 attr)
Figure 5: Class prediction results for the classification of
web site topics. The black bars in the histogram show the
number of Naive Bayes classifiers correct predictions, the
gray bars that of the j48 decision tree.
much worse performance for both classifiers. Appar-
ently, using only color information is not sufficient for
this type of classification task. When only the Edge
Histogram attributes are used, the difference between
the two classifiers is very large: the Naive Bayes clas-
sifier performs very well, predicting 70 pages cor-
rectly (58% accuracy), whereas the J48 decision tree
only predicts 52 pages correct (43% accuracy). This
suggests that in fact many edge frequencies are pre-
dictive and their effects are relatively independent of
other features.
The feature selection shows that the best predict-
ing attributes are all from the Tamura and Gabor fea-
ture vectors. For the Tamura features, these include
the same directionality attributes as in the previous
experiment but here the coarseness of the image is
WEBIST 2010 - 6th International Conference on Web Information Systems and Technologies
250

also indicative of the newspaper class. An explana-
tion for this is that the newspaper sites have a lot of re-
curring components (such as photograph thumbnails)
that are recognized as being part of a very coarse tex-
ture.
The fact that simple color and edge histogram fea-
tures are no longer among the best predicting features
indicates that this classification task is more difficult.
More sophisticated visual information, which is at
least partly provided by the Tamura and Gabor fea-
ture, produces a better classification. The best classifi-
cation results after feature selection are obtained with
the top 10 attributes. Here, the Naive Bayes model
classifies 70 pages correctly (43% precision) and the
J48 tree predicts the correct class for 68 pages (43%
precision). These results are also shown in Figure 5
Analysis of the accuracy by class shows that
learned models perform much worse for the hotel
class than for the other three classes. Only five in-
stances were correctly classified as hotel web pages,
the rest were mostly classified as conference sites.
Both web page topics have relatively simple designs,
especially when compared to the other classes, thus
making it harder to distinguish between these two
classes. A more specific example of a classifica-
tion error is the misclassification of the German ’Bild
Zeitung’ web page as a celebrity site. A look at
the homepage shows that indeed it looks more like a
celebrity site (large photographs, a lot of dark colors
and large visual elements).
7 CONCLUSIONS AND
DISCUSSION
The experiments showed that low level features of
webpages are able to distinguish between several
classes that vary in their Look and Feel, in particular
aesthetically well-designed vs. badly designed, recent
vs. old sites and different topics. These features are
obtained directly from pages as they are rendered by
web browsers and displayed on the screen. This ap-
proach is therefore independent of the environment
and format in which the site was constructed.
We found that for classification based on aesthetic
value and recency, simple features such as a color his-
togram and edge histograms provide very good re-
sults. For the more difficult task of classifying web
pages by their topic, more elaborate visual features
provide better results.
Although these simple, global features already
provide good classification results, using more spe-
cific visual features can significantly boost the accu-
racy. As we have noted in Section 5, a visual dif-
ference between older and newer web pages is the
use of blue underlined text. Our simple RGB color
histogram cannot distinguish the use of the specific
color blue, its bins only count number of pixes of a
certain brightness. More specific color features such
as the adherence to ’good’ design color schemes can
produce better results. Combinations with the visual
features described for example by (Mandl, 2006) can
also improve the results .
More local features can also have a positive ef-
fect. By identifying different visual elements on a
web page (photograph, text block, banner, etc.), we
can construct more abstract features that can be used
to better classify the pages.
Finally, our future work will focus on the integra-
tion of these visual features with other features of web
pages. This includes the textual context and the un-
derlying HTML, the used technologies and function-
alities of a web page. By combining visual and the
underlying HTML, we can better identify elements on
a web page, which can be used as better features for
classification.
This paper presents a first step towards an advice
system that assists the design and assessment of web
sites. From a research perspective it is interesting be-
cause it shows that objective and operational analysis
of Look and Feel of websites is possible. This enables
a wide range of possibilities for research on the rela-
tions between features of websites and the effect that
this has on different types of users. At the technical
side it seems likely that more abstract features will
be needed for finer discrimination between different
types of sites as in for example (Evers and Day, 1997;
Moss et al., 2006).
8 A SITE ASSESSMENT TOOL
The resulting classifiers described in this paper are
used for an online site assessment tool. In previ-
ous work, we have developed a tool that is able to
analyze a website based on the content and topics
on that website’s pages. This research provides us
with the means to analyze the visual appearance of a
target site. Using the best classifiers resulting from
the three experiments described in this paper, we
can classify a new page on three orthogonal dimen-
sions: beauty/ugliness, up-to-dateness of the design
and whether or not the site looks like one of the four
web site topics introduced in Section 6. We expect
that this information can be of value to (amateur) web
designers or web site owners.
Figure 6 shows a screenshot of the current version
of the tool. The site allows a user to enter a URL.
CLASSIFYING WEB PAGES WITH VISUAL FEATURES
251

Figure 6: A screenshot of the current beta-version of the
online visual web site assessment tool. For this Dutch news
site the topic is correctly classified, its recency is misclassi-
fied as ’old’. The correctness of the aesthetic classification
(ugly) can be debated.
The web page is then retrieved and classified in three
dimensions, corresponding to those presented in sec-
tions 4-6. For this we use the best models learned
from the data presented here. The three classes are
presented to the user. An example output for an an-
alyzed page is: ”your website looks like a beautiful,
new celebrity website”, which depending on the ac-
tual type of the page might or might not be a good
thing.
We also included a feedback feature on the web-
site where the user can reinforce or correct the clas-
sifications. This information is then used to update
the models iteratively. We are currently looking at
possible expansions of this online tool. The analysis
of the visual appearance of a web page can be com-
bined with analysis based on textual content, techno-
logical implementation, functionalities or usage data.
Another possible expansion of the tool’s functional-
ity is that users can define their own web site topics.
Through this web site we are looking towards gaining
much more data and user evaluations of that data.
REFERENCES
Amento, B., Terveen, L., and Hill, W. (2000). Does ”author-
ity” mean quality? predicting expert quality ratings of
web documents. In In Proc. ACM SIGIR 2000, pages
296–303. ACM.
Andrade, L. (2009). The worlds ugliest websites!!!
http://www.nikibrown.com/designoblog/2009/03/03/the-
worlds-ugliest-websites/ retrieved October 2009.
Crazyleafdesign.com (2009). 40 most beautiful
and inspirational website designs of 2008.
http://www.crazyleafdesign.com/blog/top-40-
beautiful-and-inspirational-website-designs-of-2008/
retrieved October 2009.
Ester, M., Kriegel, H.-P., and Schubert, M. (2002). Web site
mining: a new way to spot competitors, customers and
suppliers in the world wide web. In KDD, pages 249–
258. ACM.
Evers, V. and Day, D. L. (1997). The role of culture in in-
terface acceptance. In Howard, S., Hammond, J., and
Lindgaard, G., editors, INTERACT, volume 96 of IFIP
Conference Proceedings, pages 260–267. Chapman &
Hall.
Fogg, B. J., Marshall, J., Laraki, O., Osipovich, A., Varma,
C., Fang, N., Paul, J., Rangnekar, A., Shon, J., Swani,
P., and Treinen, M. (2001). What makes web sites
credible?: a report on a large quantitative study. In
CHI ’01: Proceedings of the SIGCHI conference on
Human factors in computing systems, pages 61–68,
New York, NY, USA. ACM.
Hollink, V., de Boer, V., and van Someren, M. (2009).
Siteguide: An example-based approach to web site de-
velopment assistance. In Filipe, J. and Cordeiro, J.,
editors, WEBIST, pages 143–150. INSTICC Press.
Kwon, O.-W. and Lee, J.-H. (2003). Text categorization
based on k-nearest neighbor approach for web site
classification. Inf. Process. Manage., 39(1):25–44.
Lux, M. and Chatzichristofis, S. A. (2008). Lire: lucene
image retrieval: an extensible java cbir library. In MM
’08: Proceeding of the 16th ACM international con-
ference on Multimedia, pages 1085–1088, New York,
NY, USA. ACM.
Mandl, T. (2006). Implementation and evaluation of a
quality-based search engine. In HYPERTEXT ’06:
Proceedings of the seventeenth conference on Hyper-
text and hypermedia, pages 73–84, New York, NY,
USA. ACM.
Moss, G., Gunn, R., and Heller, J. (2006). Some men like
it black, some women like it pink: consumer impli-
cations of differences in male and female website de-
sign. Journal of Consumer Behaviour, 5:328–341.
Park, D. K., Jeon, Y. S., and Won, C. S. (2000). Efficient
use of local edge histogram descriptor. In MULTIME-
DIA ’00: Proceedings of the 2000 ACM workshops
on Multimedia, pages 51–54, New York, NY, USA.
ACM.
Tamura, H., Mori, T., and Yamawaki, T. (1978). Textural
features corresponding to visual perception. Systems,
Man, and Cybernetics Society, 8:460–473.
The Internet Archive Wayback Machine (2009).
The internet archive wayback machine.
http://www.archive.org.
WEBIST 2010 - 6th International Conference on Web Information Systems and Technologies
252
