
UPCITY: A SERVICE-ORIENTED ARCHITECTURE
FOR E-PARTICIPATION
Adrian Buzgar and Sabin Buraga
Faculty of Computer Science, “Alexandru Ioan Cuza” University, Iaşi, Romania
Keywords: eGovernment, Rich internet application, Service-oriented architecture, GIS, Zoomable user interfaces.
Abstract: This paper proposes U
PCITY, a Service-Oriented Architecture for eGovernment. UPCITY tracks the stages of
a local community problem-solving workflow on an interactive map, by using a zoomable user interface, as
well as a timeline to add a temporal dimension to data present in the system. Usability related features, as
well as interoperability with popular social networks, are used to encourage citizen participation. We
provide an extensible platform by means of a flexible plug-in system, exemplified by an epidemic tracker.
1 INTRODUCTION
With eGovernment, technologies that are maturing
in the context of Web 2.0 (O’Reilly, 2005) can be
leveraged to help governance reach a broader
audience and a closer, more direct relationship with
citizens. In most developed countries, the question is
no longer whether the government is present online,
but rather to what extent (Chadwick & May, 2003).
This work proposes U
PCITY, a collaborative
online platform which aims to involve citizens,
authorities and other third parties in a partnership for
local and regional development. In the current
implementation phase, our project seeks to increase
the efficiency of solving community problems at a
local level, and to facilitate information exchange
especially in the case of success stories at a national
level and even across state borders. Being a
platform, U
PCITY provides a flexible plug-in system
for other purposes, such as tracking epidemics.
The current technological backdrop together with
the pervasive nature of online social networking,
provide new avenues for eGovernment applications
to reach their users, with a better chance at fulfilling
the promise of democratizing governance. In the
case of our project, we consider that using popular
social networks, such as Twitter (Java et al., 2007),
can speed up information exchange and help raise
awareness, owing to the viral pattern of information
spread offered by microblogging.
From a technical perspective, we believe that
blending Geographical Information Systems (GIS)
(Dangermond, 2009) with current generation Rich
Internet Application (RIA) frameworks improves
usability. Moreover, in the case of such large data-
spaces, we use techniques such as zoomable user
interfaces (Gundelsweiler et al., 2007) to enhance
visualization and navigation.
The paper starts with a brief domain overview,
towards the end of which we point out a set of
principles that have shaped U
PCITY. We then
describe the Service-Oriented Architecture (Erl,
2005) of our platform, with emphasis on
interoperability and extensibility via the plug-in
system. Our work continues with a case-study that
lists key features of the current implementation
phase of the project. Finally, we lay out the next
phases of the project and come to conclusions.
2 RELATED WORK
A recent UN survey (UN, 2008a) placed Sweden,
Denmark and Norway in the top three positions of a
global eGovernment readiness index, with Romania
ranking 51
st
.
From an economic viewpoint, eGovernment is a
growing sector, with incentives coming from
governments and regional entities such as the
European Council, aimed at encouraging software
solutions to improve government services and
interaction with citizens and businesses. Initiatives
such as the European Union i2010 development
strategy (EC, 2005), focus on software for efficient
information dissemination for governance-related
325
Buzgar A. and Buraga S.
UPCITY: A SERVICE-ORIENTED ARCHITECTURE FOR E-PARTICIPATION.
DOI: 10.5220/0002803703250332
In Proceedings of the 6th International Conference on Web Information Systems and Technology (WEBIST 2010), page
ISBN: 978-989-674-025-2
Copyright
c
2010 by SCITEPRESS – Science and Technology Publications, Lda. All rights reserved
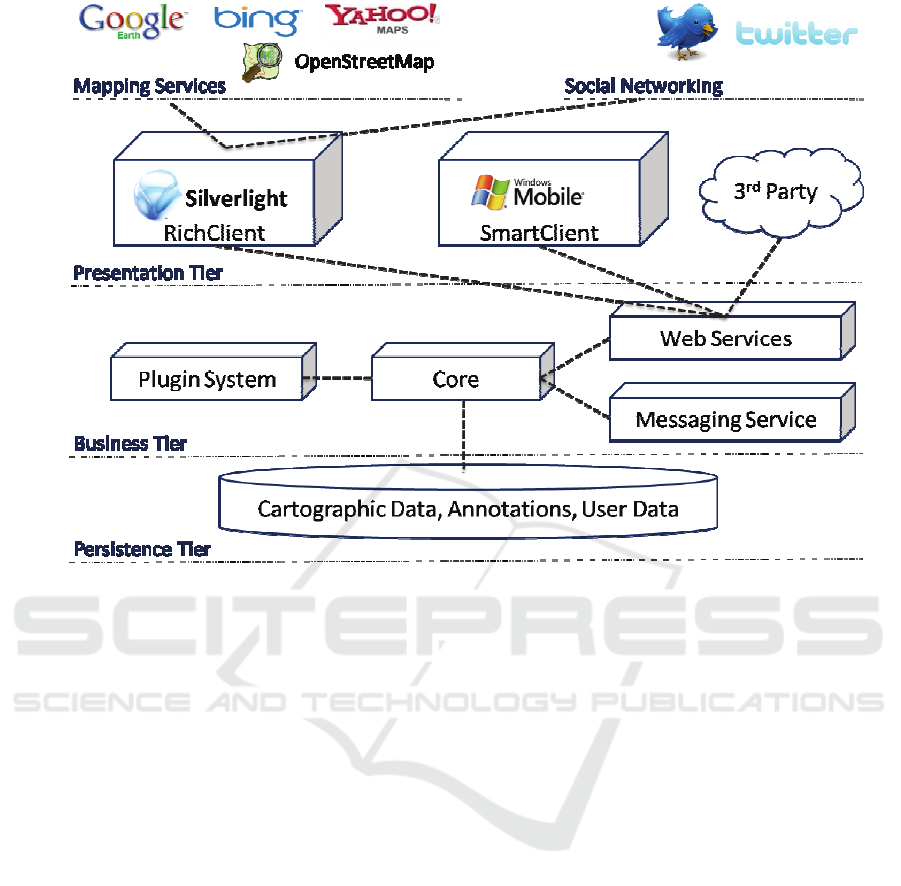
Figure 1: UpCity Architecture.
issues, but also increasingly on citizen participation
in the process of local and national decision making.
Projects geared towards eGovernment suffer
from the same development issues as any other
software, however the issue is often compounded by
the fact that such projects are funded through
taxpayer funds and should return investment through
effective and efficient use. U
PCITY was initially
planned as a submission for the Software Design
category of Imagine Cup 2009, one of the most
popular IT-oriented student competitions, organized
and sponsored by Microsoft. As such, we had less
practical financial issues to resolve, but rather
planned the system so as to reduce the total cost of
ownership for a future deployment with local
authorities.
A number of frameworks (Jones et al., 2007;
Gupta & Jana, 2003) have been proposed for the
purpose of evaluating eGovernment applications.
Authors contend that a fine-grained blend of social
and non-social factors need be considered when
evaluating eGovernment applications, rather than a
simple cost-benefit analysis. With the prevalence of
the Social Web in mind, we decided to avoid
creating a de novo online social network, but rather
to leverage the wide use of the most popular ones,
such as Facebook and Twitter, in order to quickly
spread information generated within our system.
Chadwick & May (2003) identified three major
interaction patterns for eGovernment applications:
‘managerial’, ‘consultative’, and ‘participative’. The
solution we present is aimed at the last, meaning the
truer form of citizen participation – or rather,
eParticipation (Macintosh, 2006). To achieve this
goal, we developed an interactive map onto which
we model a problem-solving workflow. By problems
we refer to infrastructure, health, education, public
safety, environmental or other issues, insofar as all
aspects submitted by citizens can have a clear
geographic context (e.g. their neighborhood). A
similar approach was used in an interdisciplinary
project for the metropolitan area of Venice, Italy
(Barbieri et al., 2009).
Having reviewed the above studies, a number of
goals emerged that we believe should increase the
likelihood of success of our approach: usability,
interoperability, openness, and extensibility.
Usability, as defined by the ISO (1998), is the
extent to which each context of use of an application
can achieve specified goals with effectiveness
(accuracy and completeness of a task), efficiency
(minimal amount of effort), and satisfaction.
WEBIST 2010 - 6th International Conference on Web Information Systems and Technologies
326
Interoperability refers to the broad use of Web
services for inter-platform communication, but also
3 ARCHITECTURE
3.1 Overview
Our proposed solution uses a Service Oriented
Architecture (SOA) structured on three layers, as
shown in Figure 1.
Considering usability, we have employed a Rich
Internet Application (Allaire, 2002) client-side
technology, namely Microsoft Silverlight (Scanlon,
2008; Papa, 2009). An important factor in our choice
was the availability of mapping tools for Silverlight.
We were thus able to integrate all aspects of user
interaction in the interactive map rich client.
Depending on the remoteness of a specific area,
mapping resolution – e.g. data granularity and
different levels of detail – may vary from one
provider to another. For that reason, U
PCITY offers
the possibility of dynamically changing the map
provider from a number of choices: Google Earth,
OpenStreetMap, Virtual Earth, and Yahoo Maps.
We were able to import accurate roadmap data
from the OpenStreetMap service and generate client-
side controls which can then be overlaid onto other
map tile-sources (e.g. satellite imagery). This in turn
led to the development of a lightweight plug-in for
community requested infrastructure which could be
used for rural areas where road access needs
improvement.
The rich client is also able to export reported
issues to Twitter via tinyURLs (automatically
shortened URLs), which can then be used to zoom in
directly to a problem of interest.
The mobile client of U
PCITY also resides in the
presentation tier. This is a separate application
directed at the needs of authorities in the field. Its
functionality is presented in the case study section.
The business logic of the application consists of
a modular service endpoint that defines a set of basic
operations available to different plug-ins, as well as
common services – e.g. spam filtering for the
comments. Access to the server-side ensues through
Windows Communication Foundation (WCF), a
SOAP-based protocol (Gudgin et al., 2007).
Sensitive services are secured, whereas general
information retrieval services are left as a public
API.
The persistence layer is developed using SQL
2008 (chosen for its ability to index spatial data). It
exposes a safe and heterogeneous hierarchy of
entities used by plug-ins. SQL Server 2008 provides
a number of data mining opportunities (the business
intelligence module) we are exploring.
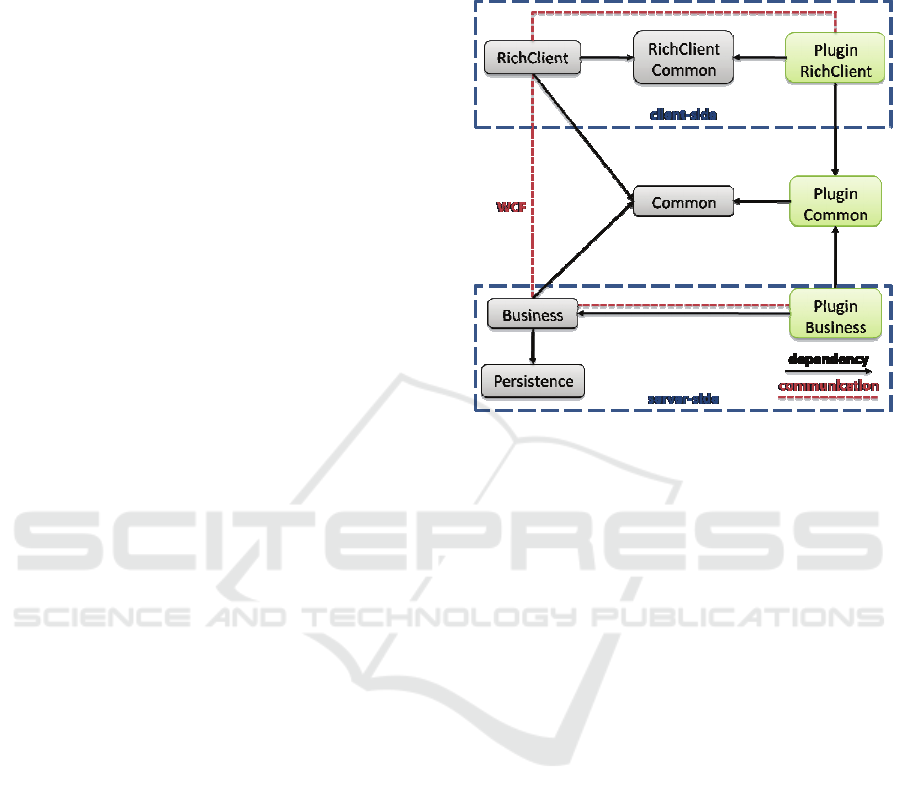
Figure 2: Plug-in System.
3.2 Details Regarding the UPCITY
Plug-in System
Extensibility is provided by a plug-in model
extending throughout each layer. Plug-ins can be
meant as core functionality (i.e. always-on, such as
the cartographic plug-in) or as actual extensions –
for example, the local community issues plug-in or
the epidemic tracking plug-in.
One noteworthy aspect is the actual management
of plug-ins as .NET or Silverlight assemblies. Since
Silverlight is actually a reduced subset of the .NET
runtime, the Dynamic Linking Libraries (DLLs)
compiled for the whole framework class set will not
function in Silverlight. In effect, two types of DLLs
are compiled, a specialized type for the client-side
and a general purpose type for the server-side, which
runs the entire .NET framework. This means that in
the case of plug-ins, common assemblies from
Figure 2 must be compiled for both platforms. In
Visual Studio, this process can be automated using
the SLAsm tool (Bendahan, 2009).
In the deployment phase, the U
PCITY rich client
currently only contains the base feature set necessary
to query the business server for available plug-ins,
which are then delivered and coupled at runtime,
based on user requests. Once a plug-in is installed,
its client-side assembly directs custom operations
towards the server-side assembly without knowledge
of the transport mechanism, which is safely hidden
UPCITY: A SERVICE-ORIENTED ARCHITECTURE FOR E-PARTICIPATION
327
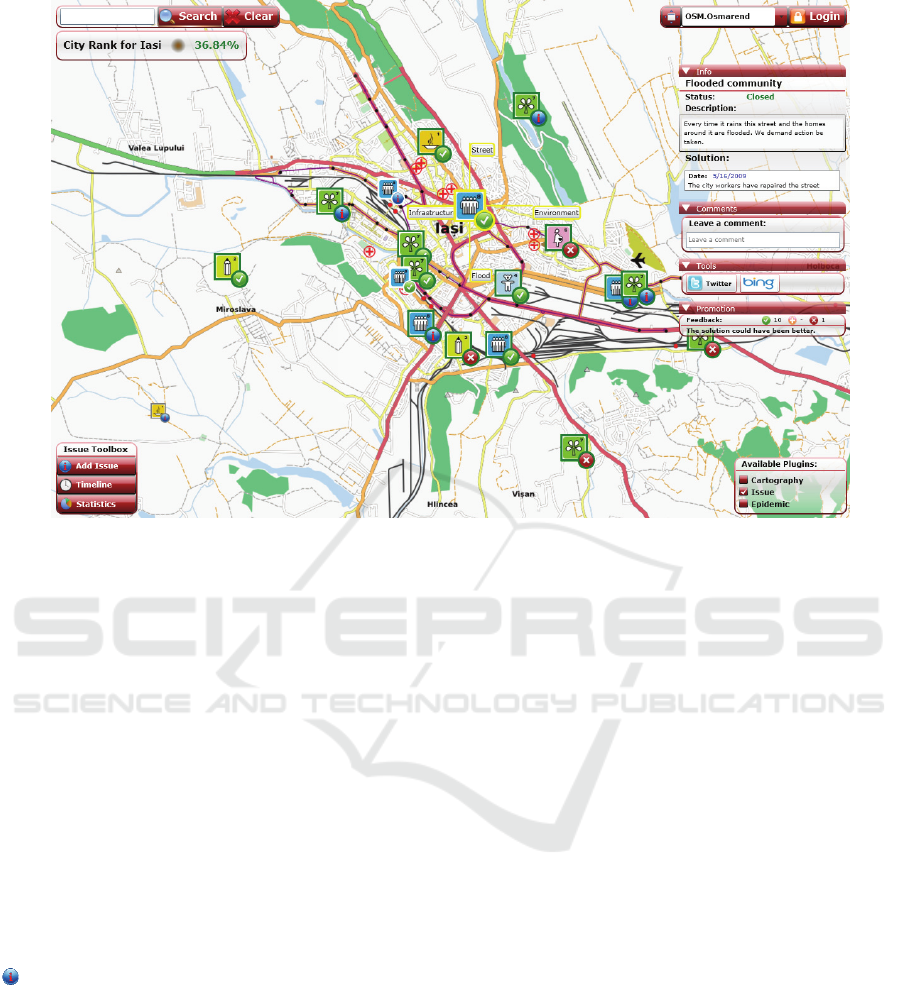
Figure 3: Issue Plug-in – the City Overview.
in the core assemblies. Likewise, the business logic
of each plug-in is responding unaware of the
communication channel. The same principle applies
to persisting custom plug-in entities, i.e. the actual
CRUD (Create-Read-Update-Delete) operations are
hidden behind a secure interface made available to
plug-ins.
4 CASE STUDY
4.1 Important Features
As previously stated, UPCITY uses a specific
workflow with community reported issues. The
following phases are observed:
Issue Reporting and Awareness Raising. In this
phase, citizens will submit problems they face in
their communities. However, before these problems
show up on the map with the identified status (the
blue icon), a validation is necessary. There are two
models present in the system that perform this task:
• An anonymous reporting system provides
citizens with an easier way of inputting
problems. This is however prone to abuse,
therefore a security policy only allows a limited
configurable amount of issues reported from a
unique address in a given time-frame (e.g. one
per day). This model is enforced on the client-
side by means of Silverlight locally stored
cookies and on the server-side by tracking
addresses. Both measures are completed with a
simple validation tool used by public servants
responsible with specific problem categories.
• Authenticated users do not have limits on the
number of reports; however, the same validation
from authorities is used to filter out spam and
other more subtle forms of abuse.
Once an issue has been validated, it is visible on
the overall map. All such entities are visualized
using the zoomable user interface using details on
demand (Shneiderman & Plaisant, 2004). In effect,
this means that most details associated with an
object are requested from the server and displayed
only when they are requested by the user, leaving
the interface free of clutter and unnecessary details.
Each issue has an associated information area
and toolset presented on the right side of Figure 3.
This includes facilities for a mini-forum – or a
similar social Web-based application – in which
other citizens can add comments and resources.
An important feature is community voting. This
can be used by authorities to assess the significance
of current problems and prioritize according to
public opinion. In order to further raise awareness,
we provide an easy method of exporting issues to a
user’s Twitter account. This generates a link that
WEBIST 2010 - 6th International Conference on Web Information Systems and Technologies
328
once followed by another individual, will navigate
U
PCITY directly to the relevant issue.
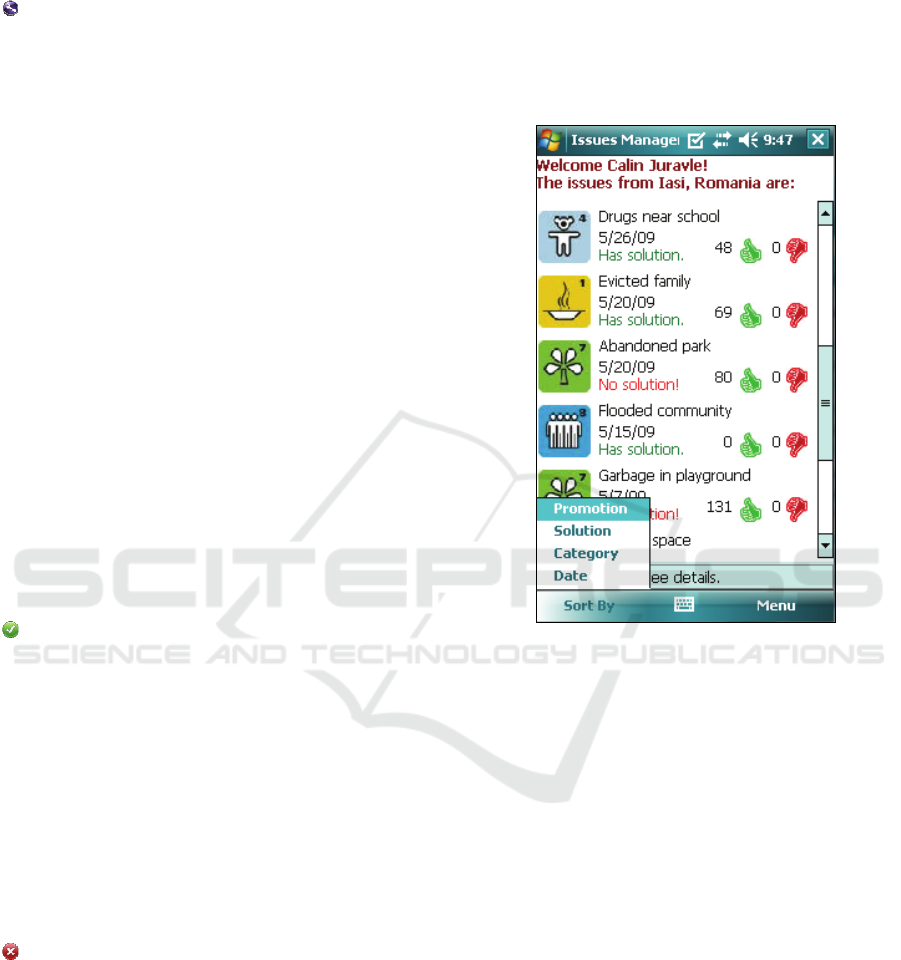
Issue Solving. This phase offers special features
for helping authorities in their efforts to solve the
reported issues. We have developed a separate
mobile client for this purpose, as shown in Figure 4.
It uses a GPS device to determine nearby reported
issues for public servants in the field. In
consequence, status reports and resources (e.g. on-
site taken photos) can be easily attached to existing
issues. The interface has been optimized for quick
access to information, through sorting based on
criteria like public opinion. This facility opens
interesting perspectives on eJournalism (Briggs,
2007).
All changes can be viewed from the Web client
in real-time, thanks to an asynchronous retrieval
mechanism. This in turn accelerates the flow of
information and makes the entire process more
efficient, besides the obvious interactivity bonus.
The Web client includes a separate management
panel for authorities. Status updates can be added
there, and the state of an issue can be changed to
reflect an applied solution. Another special feature is
that of finding similar solutions to local problems
based on previous results elsewhere. Thus, success
stories can be replicated, and inefficient measures
already taken by other local administrations can be
avoided.
Issue Closing (with positive feedback). Once a
solution has been reached – from the point of view
of the authorities – there are a number of ways to
“close” an issue. Once the state changes a feedback
process is activated, in which citizens may vote
again, this time to express their satisfaction with the
measures taken.
Depending on the initial public reaction and
other factors, a conclusion is reached in the system.
Positive or neutral results close the issue with a
green checkmark. Achieving this state will provide
satisfaction both to citizens and to public servants,
and as such promotes action and involvement on
both sides.
Issue Closing (with negative feedback or due to
inaction). In certain cases, the community may
decide that the authorities’ solution was inadequate,
in which case the corresponding icon signifies this
final state. This is also the state reached by issues
which have seen long periods of inactivity on the
part of the authorities.
Besides modeling the above workflow, we have
developed a number of other features to help
navigate the potentially large data-space, as well as
add a temporal dimension to the spatial data
presented.
All of the computation involved in the following
topics is carried out on the client machine. This is an
advantage for rich client visualizations, because it
completely offloads this task from the business
server.
Figure 4: UPCITY Mobile Client.
4.2 Tag-based Navigation
A simple folksonomy model (Fu, 2009) is used to
allow users to add significant tags to issues reported
in the system. Tags are then visually represented on
spokes coming out of each issue. Animated links are
then drawn and can be navigated towards all
matching issues present in the current visible area, as
shown in Figure 5.
This feature can then be used to assess the
outspread of a certain problem, locally as well as
regionally or globally, depending on the current
level of zooming.
4.3 Visual Approach for Searching
A number of aspects are important when discussing
search functionality for the UPCITY system. Firstly,
since most information of interest to a specific user
will be in their immediate locality – i.e. their
neighborhood or city – and the respective data is at
least partially already displayed on the client
UPCITY: A SERVICE-ORIENTED ARCHITECTURE FOR E-PARTICIPATION
329
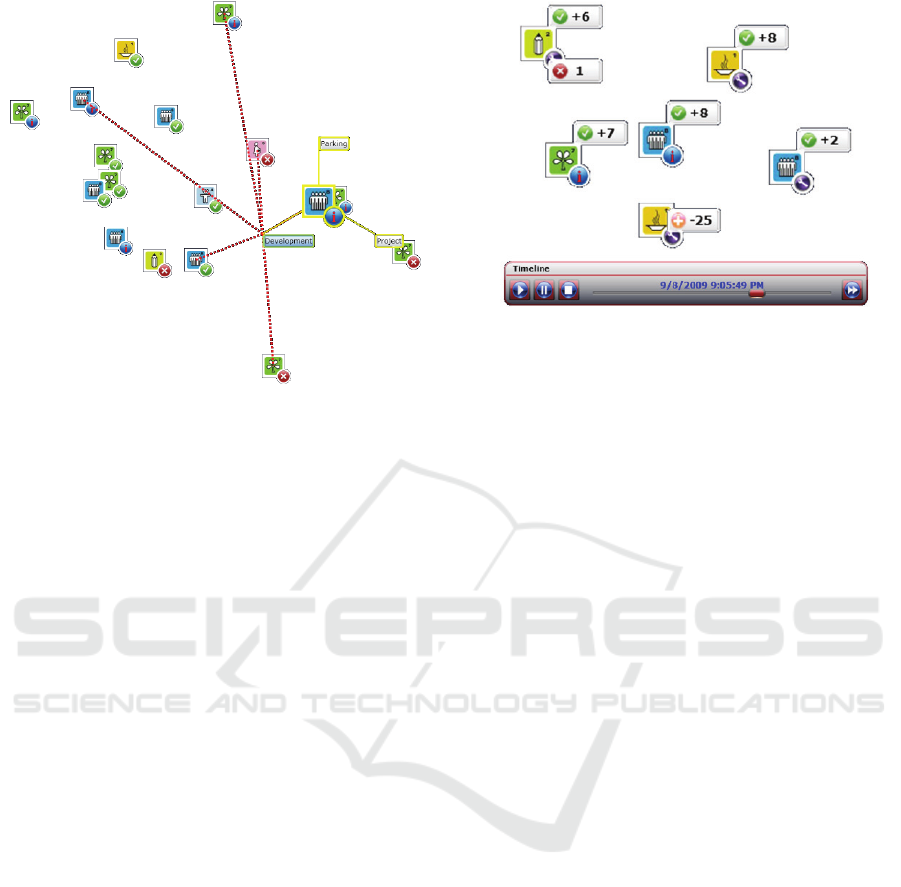
Figure 5: Tag-based Navigation.
machine, in most cases searches will not incur
server-side queries, but instead filter already loaded
data. Secondly, rather than display results in a list,
U
PCITY can take advantage of the interactive map
and show results directly at their location.
The actual process is an animation that
emphasizes matching issues by slightly increasing
their size. Moreover, non-matching data is de-
emphasized, depending on entity type – respectively
non-matching issues are grayed out and reduced in
size, while non-matching infrastructure entities (e.g.
roads) are left grayed-out, without other visual
transformations.
As such, a quick visual transition attracts the
viewer’s attention toward relevant items.
4.4 Local Statistics
The concept of locality is also used for statistics.
From the perspective of local authorities, it is only
natural that a top of the most promoted issues should
only include local data. Consequently, as the visible
area is shifted and other cities are viewed, voting
data is recalculated based on the specific locality and
shown. Since this is done in real-time, interesting
trends in issue popularity can be observed, as a
problem visibly gains the support of the local
community, and proper measures can be taken.
In order to promote a positive competition
between communities, a composite CityRank index
is computed based on community involvement and
local authorities’ efficiency. This is evident in
Figure 3 in the top-left corner.
Figure 6: U
PCITY timeline facility.
4.5 Timeline
Mapping data is a traditionally associated with static
imagery. However, in the UPCITY platform the
process involved in identifying and solving
community issues has a natural temporal dimension.
This can be depicted using the timeline facility,
which basically adds a movie control box to the
map. Figure 6 shows how user voting occurs over
time, once the timeline has been started. As the
timeline progresses, new issues will appear on the
map and older ones will switch states until they
hopefully become solved and eventually disappear.
The natural objective is then to have as few
unsolved problems as possible and to dispatch new
issues efficiently.
4.6 Extensibility Showcase: Epidemics
Using data gathered from the World Health
Organization, a plug-in was developed for
monitoring the outspread of the recent swine
influenza pandemic.
The timeline functionality, presented in the
previous section, was reused to display a worldwide
evolution of reported cases and deaths for swine flu
in May-June 2009. Only countries with reported
cases had graphical controls overlaid onto the
default satellite imagery. A snapshot regarding the
Central Europe status is visible in Figure 7.
WEBIST 2010 - 6th International Conference on Web Information Systems and Technologies
330
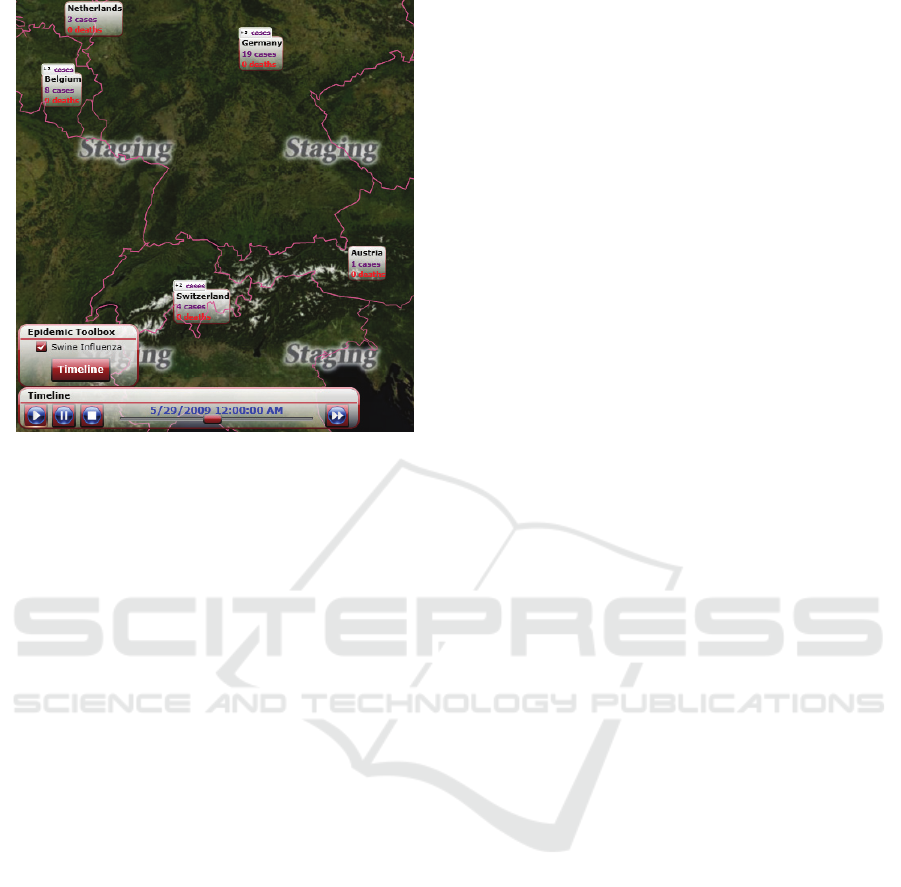
Figure 7: Swine flu tracker, the Central Europe snapshot.
5 CURRENT RESULTS
The UPCITY platform was initially planned and
developed during the Imagine Cup 2009 competition
(www.imaginecup.com), an IT-oriented event
organized by Microsoft, which has reached over
three hundred thousand participants in 2009.
The project was submitted in the Software
Design category of the competition, and won the 1st
Prize during the finals in Cairo, Egypt, in July 2009.
The competition emphasized the theme “Imagine a
world where technology helps solve the world’s
toughest challenges” and a strong relation to the
United Nations proposed MDG – Millennium
Development Goals (UN, 2008b). All issue-related
icons present in Figures 3-6 are the official icons
used by the UN to depict MDGs.
During the competition, our team has entered a
partnership with the City Hall of Iasi (pop.:
400,000), Romania, and is currently in the final
phases of deploying a pilot for the local community.
6 FURTHER RESEARCH
The next stage of our project is the local deployment
and subsequent customization of UPCITY in order to
better adapt it to the needs of the city of Iasi.
Although internal data can be accessed through our
SOAP API and linked via Twitter, there is so far no
way for search engines to index it. This is a common
problem with thick client technologies.
A possible solution would be to mirror the
internal database to a semantic repository and
remodel entities using the widespread RDF –
Resource Description Framework (Becket et al.,
2004) model, in order to provide a SPARQL
endpoint for reusing data in the context of Linked
Data initiative (Bizer, Heath & Berners-Lee, 2009).
7 CONCLUSIONS
This paper has proposed UPCITY, an eGovernment
platform aimed at eParticipation. By implementing
novel visualization patterns (zoomable user
interfaces, details-on-demand), usability increased.
This coupled with the existing feature set (i.e.
monitoring community issues in both spatial and
temporal dimensions) encourages citizens to become
involved in a partnership for development with local
authorities.
U
PCITY not only tends to the needs of citizens,
but also to those of public servants. A dedicated
mobile GPS client was developed for aiding
personnel in the field with tracking nearby issues
and providing status updates.
The proposed platform uses a Service-Oriented
Architecture, as well as a flexible plugin system to
ensure openness and extensibility. As showcased,
our system can be extended to other purposes, such
as tracking current pandemics (e.g. swine influenza).
Overall, U
PCITY leverages current Web
technologies, as well as the success of popular
online social networks, in order to serve the interests
of not only individuals, but entire communities.
ACKNOWLEDGEMENTS
We need to acknowledge the efforts of the other two
members of the Imagine Cup Software Design team,
Călin Juravle and Andreas Resios, graduates of the
Faculty of Computer Science, 'A.I. Cuza' University
of Iasi, Romania. We also thank Microsoft, the
organizers of Imagine Cup 2009, for helping our
project gain much traction and visibility. Last but
not least, we thank the City Hall of Iaşi, Romania for
their valuable support.
UPCITY: A SERVICE-ORIENTED ARCHITECTURE FOR E-PARTICIPATION
331

REFERENCES
Allaire, J. (2002). A Next Generation Client, Macromedia
Whitepaper.
Barbieri, P., Mazzariol, S., Rumor, M., & Scottà, A.
(2009). Project for the Management of the Municipal
Development Plan of Venice, Proceedings of the
Urban Data Management Society, Ljubljana.
Becket, D., McBride, B. et al. (2004). RDF/XML Syntax
Specification (Revised), World Wide Web
Consortium, http://www.w3.org/RDF/.
Bendahan, S. (2009). Converting .NET Assemblies to
Silverlight Assemblies, The Code Project,
http://www.thecodeproject.com/.
Bizer, C., Health, T., Berners-Lee, T. (2009). Linked Data
– The Story So Far, Special Issues on Linked Data,
International Journal of Semantic Web and
Information Systems (to appear).
Briggs, M. (2007). Journalism 2.0, J-Lab: The Institute for
Interactive Journalism,
http://www-j-lab.org/Journalism_20.pdf.
Chadwick, A., May, C. (2003). Interaction between States
and Citizens in the Age of the Internet: ‘eGovernment’
in the United States, Britain and the European Union,
Governance: An International Journal of Policy,
Administration and Institutions, Vol. 16 (2), Oxford,
Blackwell Publishing.
Dangermond, J. (2009). GeoEnabling Gov2.0 Keynote,
Gov2.0 Summit, Washington DC, September 2009.
Erl, T. (2005). Service Oriented Architecture: Concepts,
Technology and Design, Prentice Hall.
European Commission (2005). i2010 – A European
Information Society for Growth and Employment,
Communication from the Commission to the Council,
the European Parliament, the European Economic and
Social Committee and the Committee of the Regions.
Fu, W. (2009). A Semantic Imitation Model of Social
Tagging, Proceedings of the IEEE Conference on
Social Computing, IEEE Press.
Gudgin, M., Headley, M. et al. (2007). SOAP Version 1.2
W3c Recommendation, World Wide Web Consortium.
Gundelsweiler, F., Memmel, T., & Reiterer, H. (2007),
ZUI Konzepte für Navigation und Suche in komplexen
Informationsräumen (ZUI Concepts for Navigating
and Searching Complex Information Spaces), i-com,
Volume 6 (1), pp. 38-47.
Gupta, M. P., & Jana, D. (2003). E-Government
evaluation: a framework and case study, Government
Information Quarterly, Vol. 20 (4), pp. 365-287.
International Standardization Organization (1998). ISO
9241 Part 11: Guidance on Usability.
Java, A. et al., (2007). Why We Twitter: Understanding
Microblogging Usage and Communities, International
Conference on Knowledge Discovery and Data
Mining, ACM Press.
Jones, S., Irani, Z., & Sharif, A. (2007). E-Government
Evaluation: Reflections on Three Organizational Case
Studies, Proceedings of the 40th Hawaii International
Conference on System Sciences, ISSN:1530-1605.
Macintosh, A. (2006). eParticipation in Policy-making: the
Research and the Challenges, Exploiting the
Knowledge Economy: Issues, Applications, Case
Studies, IOS Press.
O’Reilly, T. (2005). What Is Web 2.0?, O’Reilly Media.
Papa, J. (2009). Data-Driven Services with Silverlight 2,
O’Reilly Media.
Scanlon, J. (2008). Accelerated Silverlight 2, APress.
Shneiderman, B., & Plaisant, C. (2004). Designing the
User Interface (4
th
Edition), Addison-Wesley.
United Nations (2008a). UN eGovernment Survey 2008,
Department of Economic and Social Affairs of the
United Nations, Division for Public Administration
and Development Management.
United Nations (2008b). The Millennium Development
Goals Report, http://www.un.org/millenniumgoals/.
WEBIST 2010 - 6th International Conference on Web Information Systems and Technologies
332
