
ADAPTIVE MOTION ARTIFACT FILTER FOR
PHOTOPLETHYSMOGRAM EXTRACTION
O. Abdallah, A. Piera Tarazona, T. Martínez Roca, K. Abo Alam and A. Bolz
Institute of Biomedical Engineering, Karlsruhe Instiute of Technology, Germany
Keywords: Adaptive filter, Photoplethysmogram, Motion artifacts, Oxygen saturation, Pulse oximetry.
Abstract: Adaptive filters have been used to enable the robust measurement of photoplethysmogram (PPG) under
conditions of the motion artifact which causes a high noise to the signal. In this adaptive filter a noise
reference and a signal reference are used. The least mean square (LMS) method was applied to extract the
actual signal from the noisy one. For the first approximation to generate the reference signal, a low pass
filter is used. Based on the resulting signal, an appropriate reference signal is generated. This reference
signal is in turn subtracted from the detected signal to generate a noise signal. The generated noise signal is
modified to synthesize the noise reference signal. The synthesized reference noise is adjusted by the
adaptive algorithm to the real one contained in the measurement, and then subtracted from the detected
noisy signal. The filtered signals can be used to determine various physiological parameters such as the
fractional oxygen saturation or the other blood components. Calculating the oxygen saturation using the
filtered PPGs subjected to artifacts looks promising when compared to the calculated values using PPGs
without motion artifacts, for the same case.
1 INTRODUCTION
The photoplethysmogram (PPG) plays a central role
for noninvasive monitoring and early diagnosis. Not
only will PPG and the principle of spectroscopy be
used to calculate oxygen saturation and biochemical
concentrations in blood like hemoglobin and
glucose, but also in combination with other
measured parameters it will be used to calculate
more parameters and hence enables a valuable
diagnosis (
Mendelson, 1992), (Ali-Munive, 2002).
Pulse oximetry is a valuable and widely
employed non-invasive method to monitor oxygen
saturation. But motion artifacts, especially for
monitoring the fractional oxygen saturation, entail
great limitations and often become an
insurmountable obstacle in the utilization of this
technology, since they appear in the same
frequencies as the desired signal and their amplitude
order is quite large compared to the amplitude levels
of pulse signals. Due to this frequencies overlap,
indiscriminate filtering cannot be tolerated, for
reasons of signal clarity preservation (Abdallah,
2003), (Vora, 2004), (Masimo Corporation).
In order to develop a multisensor for diagnosing
cardiovascular diseases and computing the fractional
oxygen saturation, an adaptive filter, that allows the
detection of the PPG by one or more sensors under
conditions of motion artifacts, has been explored. By
this way, it will be possible to establish the
fractional oxygen saturation values even under
motion circumstances. The main advantage of the
algorithm implementing the adaptive filter is that it
needs just one PPG.
To develop a full-featured system successfully
without any other help, else one PPG signal, an
implementation based on a noise cancellation
configuration is carried out and the noise reference
necessary for its proper operation is synthesized
from the PPG signal itself. Amongst all the possible
adaptive algorithms that can be used, due to its low
computational cost, the Least Mean Square
algorithm has been selected, which improves the
quality of the PPGs by cancelling the effects of
motion artifacts.
Many experiments are performed to test the
capabilities of the proposed system. The results
indicate that the effects of motion artifacts are to a
large extent cancelled and the recovered PPG
signal’s quality is good enough for measuring the
fractional oxygen saturation of the haemoglobin in
blood. Further blood contents like glucose and
physiological parameters can be extracted in a way
187
Abdallah O., Tarazona A., Roca T., Alam K. and Bolz A. (2010).
ADAPTIVE MOTION ARTIFACT FILTER FOR PHOTOPLETHYSMOGRAM EXTRACTION.
In Proceedings of the Third International Conference on Biomedical Electronics and Devices, pages 187-190
DOI: 10.5220/0002743901870190
Copyright
c
SciTePress
that could allow monitoring them under artifacts.
2 METHOD
When a conventional adaptive filter system has to be
used, the first requirement consists of having two
signals:
• The input signal coming from the sensor.
• A reference signal that has to be an ideal version
of the input signal, as the adaptive algorithm
works to make the input signal as similar as
possible to the reference signal.
The first decision was to reject the use of a
conventional adaptive filter implementation, because
a priori there is no reference pulse signal for a given
person at every moment. So, we considered an
adaptive noise cancellation system as possible
solution. But, when we use an adaptive noise
cancellation system, two input signals are needed
again; now they are:
• The input signal or, expressed in other words, the
measurement coming from the sensor. That is to
say, the same requirement as the one presented
above.
• A noise reference signal that must be similar to the
real noise that our measurements contain, but not
necessarily equal to it, as in this case, the filter
tries to eliminate this real noise while leaving the
desired signal (pulse signal) unchanged. That is a
great advantage compared to having to generate a
perfect pulse signal, as unlike synthesizing a pulse
reference, synthesizing a noise reference similar to
the real noise coming from the sensor is actually
feasible.
We do not have that noise reference signal at our
disposal, and this fact leads us to synthesize this
second input by designing a synthesizer.
Figure 1: Block diagram of the Main Program.
A broad outline of the implementation of the
algorithm that has been devised is given in Figure 1,
where the interaction between the two principal
cornerstones of the design, the Adaptive Noise
Cancellation System and the Noise Reference
Synthesizer, can be noticed. Once we have correctly
generated a Noise Reference Signal by means of the
Synthesizer, it will be adjusted as much as possible
to the real noise contained in the corresponding
measurement by the adaptive filter. In our case, this
filter is composed of a noise cancellation
configuration which uses a Least Mean Square
algorithm as adaptive algorithm. What we get as
output from the system is a denoised pulse signal.
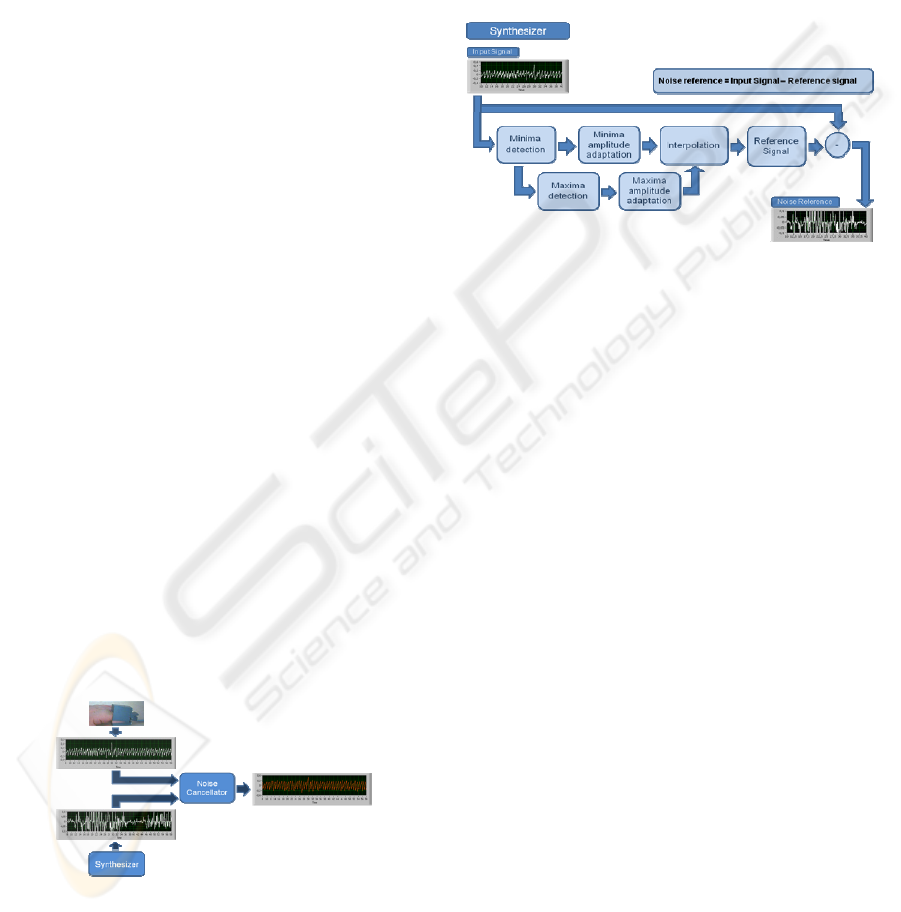
Figure 2: Block diagram of the Synthesizer.
The Synthesizer generates a Noise Reference, which
is necessary for the Adaptive Noise Cancellation
System, by means of generating an ideal pulse
signal, called Pulse Reference Signal. Figure 2
presents the basic block diagram of this Synthesizer.
Given that the Reference Signal has to follow the
Input Signal, it has to be created according to the
current Input Signal at each moment. For that
reason, it is, first of all, required to know the number
of periods that the corresponding Input signal has.
Therefore, in the Minima Detection block we search
and find all the pulse minima locations in the Input
Signal, since there are as many periods as there are
minima–1. In order to generate a more reliable
Reference Signal, the amplitude values of these
minima are also calculated along with the locations
and amplitude values of the maxima appearing in the
Input Signal, using the Maxima Detection block.
Each minimum and maximum’s amplitude are
adjusted to the corresponding Input Signal period.
Using the Interpolation block, the Reference Signal
is generated with as many periods as the current
Input Signal and with the same amplitude. Once this
pulse reference signal, Reference Signal, is
generated, we are able to obtain a noise model by the
following equation:
Noise Reference=Input Signal - Reference Signal (1)
As previously mentioned, an adaptive noise
cancellation system has two inputs, as shown in
Figure 3. One is the Input Signal, i.e. the signal
BIODEVICES 2010 - International Conference on Biomedical Electronics and Devices
188

corrupted by noise, coming from the sensor, and the
other one is the Noise Reference, coming from the
Synthesizer output. Given that the Least Mean
Square algorithm provides adaptive filtering, the
Noise Reference is adjusted to the real noise
measured by the sensor and, as a result, the output,
Filtered Signal, naturally is the denoised signal.
Figure 3: Block diagram of the Adaptive Noise
Cancellation (ANC).
3 RESULTS
To make possible SpO2 measurements, we need to
compare two PPGs at the same time with two
different wavelengths. For that reason, we required a
multi-wavelength featured sensor such as the PHM
used at the institute's laboratory, which has eight
different LEDs.
In order to test our system capabilities, it was
essential to obtain somehow measurements with the
employed PHM sensor that simulates those taken in
real situations in which PPGs presents drawbacks
that make computing medical parameters by means
of photoplethysmography unfeasible.
With the purpose of simulating these kinds of
conditions at our laboratory, the sensor was
subjected to movement, thereby emulating typical
motion artifacts that are usually presented in the
pulse signal when it is measured under extreme
conditions such as within a moving ambulance.
The measurements were carried out alternatively
between intervals of time without movement and
intervals with movement of the finger, hand and
even arm varying in speed and intensity. Each
measurement from this PHM sensor contains as
many signals as LEDs on. Since we need two of
them, first we have to separate the signals. Once
these single signals are presented separately, we
select two of them that have been measured with the
proper wavelengths value like 970 nm and 660 nm.
Then they are already adapted for being filtered by
our system. Finally, the filtered signals obtained
after the program execution can already be used to
compute ratios regarding the SpO2, such as the so-
called Ω ratio:
11
12
21
22
(,)
ln
(,)
(,)
ln
(,)
I
I
I
I
t
t
t
t
λ
λ
λ
λ
Ω=
(2)
Where:
I(λ
1
, t
1
), I(λ
1
, t
2
), I(λ
2
, t
1
) and I(λ
2
, t
2
) are the light
intensities measured at the instants t
1
and t
2
, with the
wavelengths λ
1
and λ
2
, respectively.
As results, examples of each step of the process
described here are presented. First of all, examples
of the appearance of PHM measurements (and
therefore, multi-wavelength measurements) are
shown, both the whole measurement and a zoom of
it. Next, the output given by the recovery of each
single signal coming from only one LED is also
presented. To demonstrate the ability of the
proposed system to make possible a precise enough
computation of the SpO
2
, we have calculated the
value of the above-named Ω ratio for several
measurements. In order to make sure that the
adaptive filter works well enough to get accurate
SpO
2
readings, the main goals are: first, to prove that
the ratios obtained are included in an acceptable
range (bearing in mind that the values of this ratio
allow us to estimate the calibration that has to be
applied later to the exact calculation of the SpO
2
).
Next, it must be proved that the values for the ratio
when the signal is affected by motion artifacts keep
quite unchanging compared to those stretches of the
same signal where there is no noise.
Figure 4, shows the PHM measurements. There
are seven emitting diodes; each signal coming from
each LED presents a different mean amplitude level
and a reference level. After the recovery of each
single signal, and once the reference level has been
subtracted, the outcome of the Figure 5 is given,
which is the result of recovering each single signal
contained in the previous measurement.
From the group of four graphs on the top of the
Figure 6, the two on the left are parts (delimited by
t
0
and t
1
) without noise of two signals from the same
PHM measurement, corresponding to the signal
coming from the LED configured with infrared
wavelength and the LED configured with red
wavelength.
ADAPTIVE MOTION ARTIFACT FILTER FOR PHOTOPLETHYSMOGRAM EXTRACTION
189
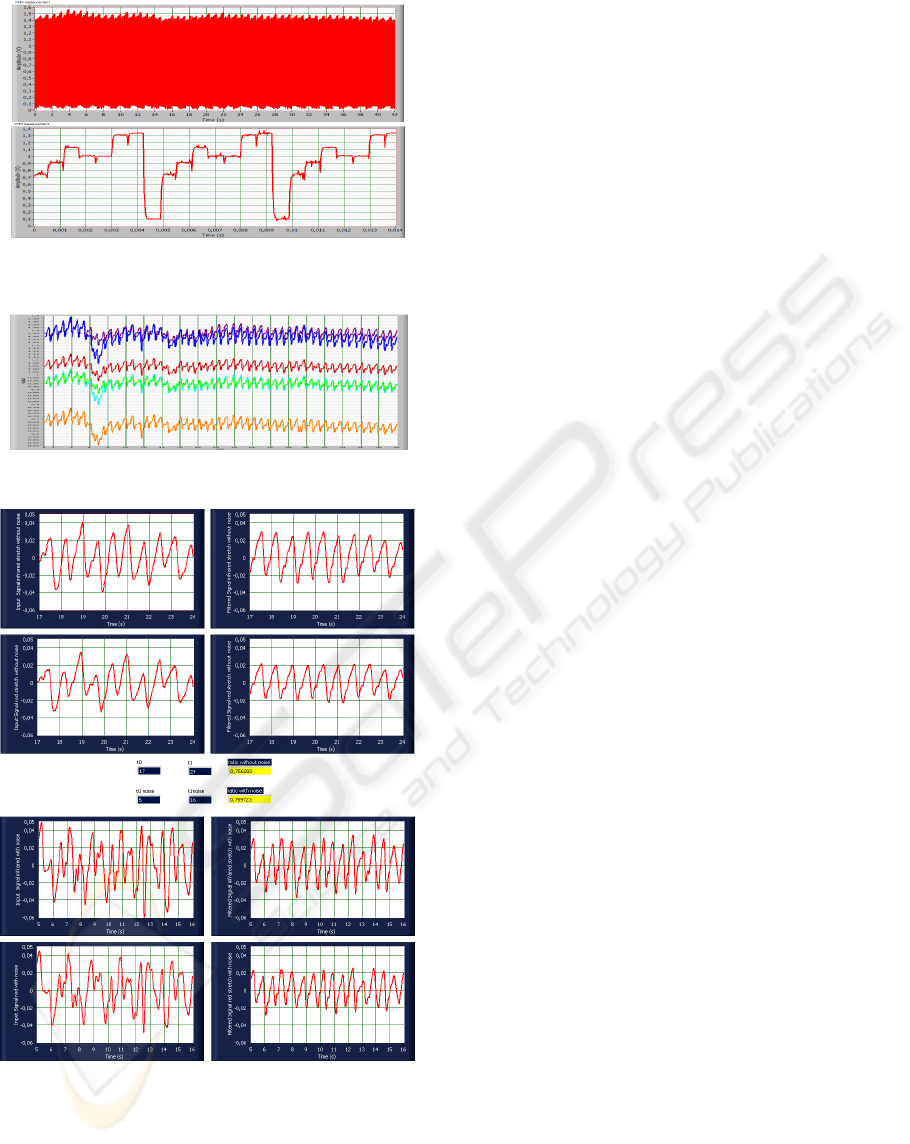
Figure 4: PHM measurement and detail of the different
signals appearing in the PHM measurement.
Figure 5: Signals recovered from a PHM measurement.
Figure 6: LabVIEW printing for filtering a PHM
measurement and computing Ω .
The two plots on the right are the result of filtering
these two signals. Analogously, the group of four
graphs on the bottom represents two parts (delimited
by t
0
noise and t
1
noise) with noise of the same two
signals from the same PHM measurement. In the
middle, the two values for the ratio Ω, one
corresponding to the noisy stretch of the signals and
the other one corresponding to the clean stretch are
presented.
4 CONCLUSIONS
Both, for long-term and short-term monitoring (for
example, in case of an emergency) of biosignals, the
use of an adaptive filter becomes essential. The
developed algorithm implementing the adaptive
filter is applicable to the PPG signal, which is
needed for the computation of several vital
parameters (such as SpO2, HR and blood pressure
fluctuations) and also for diagnosing. In fact, the
results indicate that the signal recovered from this
implementation has enough quality for measuring
the fractional oxygen saturation of the haemoglobin
in blood.
Furthermore, after a few modifications, this
algorithm can be used for electrocardiogram (ECG)
and it is also possible to carry out more adjustments
to other parameters such as electroencephalogram
(EEG), electrooculogram (EOG) and fetal ECG
(FECG).
REFERENCES
Abdallah, O., 2004, Optical Non-invasive Calculation of
Hemoglobin Components concentrations ans
Fractional oxygen Saturation Using a Ring Scatterin
Pulse Oximeter, Proc. of the SPIE-Photonics West
(BIOS), Volume 5325, pp. 51-61, San Jose, USA.
Ali-Munive A., Rodriguez P., Gomez S., Arce A. M. and
Rodriguez E., 2002, Correlación entre Pulsioximetría
y Saturación Arterial de Oxïgeno en Pacientes en
Cuidado Intensivo, Bogotá.
Masimo Corporation, http://www.masimo.com
Mendelson Y., 1992, Pulse Oximetry: Theory and
Applications for Noninvasive Monitoring, Clinical
Chemistry, Vol. 38, No. 9, pp. 1601-1607, Worcester.
Vora Vadana A. and Ahmedzai, S. H., 2004, Pulse
Oximetry in supportive and palliative care, Vol. 12,
No. 11, pp. 758-761, Sheffield, UK.
BIODEVICES 2010 - International Conference on Biomedical Electronics and Devices
190
