
ON REDUCING DIMENSIONALITY OF DISSIMILARITY
MATRICES FOR OPTIMIZING DBC
An Experimental Comparison
∗
Sang-Woon Kim
Department of Computer Science and Engineering, Myongji University, Yongin, 449-728 South Korea
Keywords:
Dissimilarity-based Classifications, Dimensionality reduction schemes, Prototype selection methods.
Abstract:
One problem of dissimilarity-based classifications (DBCs) is the high dimensionality of dissimilarity matri-
ces. To address this problem, two kinds of solutions have been proposed in the literature: prototype selection
(PS) based methods and dimensionality reduction (DR) based methods. The DR-based method consists of
building the dissimilarity matrices using all the available training samples and subsequently applying some of
the standard DR schemes. On the other hand, the PS-based method works by directly choosing a small set of
representatives from the training samples. Although DR-based and PS-based methods have been explored sep-
arately by many researchers, not much analysis has been done on the study of comparing the two. Therefore,
this paper aims to find a suitable method for optimizing DBCs by a comparative study. In the experiments, four
DR and four PS methods are used to reduce the dimensionality of the dissimilarity matrices, and classification
accuracies of the resultant DBCs trained with two real-life benchmark databases are analyzed. Our empirical
evaluation on the two approaches demonstrates that the DR-based method can improve the classification ac-
curacies more than the PS-based method. Especially, the experimental results show that the DR-based method
is clearly more useful for nonparametric classifiers, but not for parametric ones.
1 INTRODUCTION
Dissimilarity-based classifications (DBCs) (Pekalska
and Duin, 2005), (Pekalska and Paclik, 2006) are a
way of defining classifiers among the classes, and
the process is not based on the feature measurements
of individual object samples, but rather on a suitable
dissimilarity measure among the individual samples.
The advantage of this method is that it can avoid the
problems associated with feature spaces, such as the
curse of dimensionality and the issue of estimating a
number of parameters (Kim and Oommen, 2007).
In DBCs, a good selection of prototypes seems to
be crucial to succeed with the classification algorithm
in the dissimilarity space. The prototypes should
avoid redundancies in terms of selection of similar
samples, and prototypes should include as much in-
formation as possible. However, it is difficult for us to
find the optimal number of prototypes. Furthermore,
there is a possibility that we lose some useful informa-
∗
This work was supported by the National Research
Foundation of Korea funded by the Korean Government
(NRF-2009-0071283).
tion for discrimination when selecting the prototypes.
To avoid these problems, in (Bicego and Figueiredo,
2004), (Riesen and Bunke, 2007), and (Kim and Gao,
2008), the authors separately proposed an alternative
approach where all of the available samples were se-
lected as prototypes, and, subsequently, a scheme,
such as linear discriminant analysis, was applied to
the reduction of dimensionality. This approach is
more principled and allows us to completely avoid the
problem of finding the optimal number of prototypes
(Bunke and Riesen, 2007).
In this paper, we perform an empirical evaluation
on the two approaches of reducing the dimensionality
of dissimilarity matrices for optimizing DBCs: pro-
totype selection (PS) based methods and dimension
reduction (DR) based methods. In PS-based meth-
ods, we first select the representative prototype subset
from the training data set by resorting to one of the
prototype selection methods as described in (Pekalska
and Duin, 2005) and (Pekalska and Paclik, 2006).
Then, we compute the dissimilarity matrix, in which
each individual dissimilarity is computed on the ba-
sis of the measures described in (Pekalska and Paclik,
235
Kim S. (2010).
ON REDUCING DIMENSIONALITY OF DISSIMILARITY MATRICES FOR OPTIMIZING DBC - An Experimental Comparison.
In Proceedings of the 2nd International Conference on Agents and Artificial Intelligence - Artificial Intelligence, pages 235-240
DOI: 10.5220/0002713002350240
Copyright
c
SciTePress

2006). In addition, for a testing sample, z, we com-
pute a dissimilarity column vector, δ(z), by using the
same measure. Finally, we perform the classification
by invoking a classifier built in the dissimilarity space
and by operating the classifier on δ(z).
On the other hand, in DR-based methods, we pre-
fer not to directly select the prototypes from the train-
ing samples; rather, we employ a way of using a stan-
dard DR scheme, after computing the dissimilarity
matrix with the entire training samples. Then, as in
PS-based methods, we compute a dissimilarity col-
umn vector for a testing sample and perform the clas-
sification of the vector by invoking a classifier built
in the dissimilarity space. Here, the point to be men-
tioned is how to choose the optimal number of proto-
types and the subspace dimensions to be reduced. In
PS-based methods, we select the same number of (or
twice as many) prototypes as the number of classes in
heuristic. In DR-based ones, on the other hand, we
can use a cumulative proportion technique (Laakso-
nen and Oja, 1996) to choose the dimensions.
The main contribution of this paper is to present an
empirical evaluation on the two methods of reducing
the dimensionality of dissimilarity matrices for opti-
mizing DBCs. This evaluation shows that DBCs can
be optimized by employing a dimensionality reduc-
tion scheme as well as a prototype selection method.
Here, the aim of using the dimensionality reduction
scheme instead of selecting the prototypes is to ac-
commodate some useful information for discrimina-
tion and to avoid the problem of finding the opti-
mal number of prototypes. Our experimental results
demonstrate that the DR-based method can generally
improve the classification accuracy of DBCs more
than the prototype selection based method. Espe-
cially, the results indicate that the DR-based method
is clearly more useful for nonparametric classifiers,
but not for parametric ones.
2 RELATED WORK
Foundations of DBCs. A dissimilarity representa-
tion of a set of samples, T = {x
i
}
n
i=1
∈ ℜ
d
, is based
on pairwise comparisons and is expressed, for exam-
ple, as an n× m dissimilarity matrix D
T,Y
[·,·], where
Y = {y
j
}
m
j=1
, a prototype set, is extracted from T, and
the subscripts of D represent the set of elements, on
which the dissimilarities are evaluated. Thus, each
entry, D
T,Y
[i, j], corresponds to the dissimilarity be-
tween the pairs of objects, hx
i
,y
j
i, where x
i
∈ T and
y
j
∈ Y. Consequently, an object, x
i
, is represented as
a column vector as follows:
[d(x
i
,y
1
),d(x
i
,y
2
),··· ,d(x
i
,y
m
)]
T
,1 ≤ i ≤ n. (1)
Here, the dissimilarity matrix, D
T,Y
[·,·], is defined
as a dissimilarity space, on which the d-dimensional
object, x, given in the feature space, is represented
as an m-dimensional vector, δ(x,Y), where if x = x
i
,
δ(x
i
,Y) is the i-th row of D
T,Y
[·,·]. In this paper, the
column vector, δ(x,Y), is simply denoted by δ(x).
Prototype Selection Methods. The intention of se-
lecting prototypes is to guarantee a good tradeoff
between the recognition accuracy and the computa-
tional complexity when the DBC is built on D
T,Y
[·,·]
rather than D
T,T
[·,·]. Various prototype selection
(PS) methods have been proposed in the literature
(Loz, ), (Pekalska and Duin, 2005), (Pekalska and
Paclik, 2006). The well-known eight selection meth-
ods experimented in (Pekalska and Duin, 2005) and
(Pekalska and Paclik, 2006) are Random, Random C,
KCentres, ModeSeek, LinProg, PeatSeal, KCentres-
LP, and EdiCon. In the interest of compactness, the
details of these methods are omitted here, but can be
found in the existing literature (Pekalska and Paclik,
2006).
DBCs summarized previously, in which the repre-
sentative prototype subset is selected with a PS, are
referred to as PS-based DBCs or simply PS-based
methods. An algorithm for PS-based DBCs is sum-
marized in the following:
1. Select the representative set, Y, from the train-
ing set, T, by resorting to one of the prototype selec-
tion methods.
2. Using Eq. (1), compute the dissimilarity ma-
trix, D
T,Y
[·,·], in which each individual dissimilarity
is computed on the basis of the measures described in
(Pekalska and Duin, 2005).
3. For a testing sample z, compute δ(z) by using
the same measure used in Step 2.
4. Achieve the classification by invoking a clas-
sifier built in the dissimilarity space and by operating
the classifier on the dissimilarity vector, δ(z).
From these four steps, we can see that the perfor-
mance of the DBCs relies heavily on how well the dis-
similarity space, which is determined by the dissimi-
larity matrix, D
T,Y
[·,·], is constructed. To improvethe
performance, we need to ensure that the dissimilarity
matrix is well designed.
Dimensionality Reduction Schemes. With regard to
reducing the dimensionality of the dissimilarity ma-
trix, we can use a strategy of employing the dimen-
sionality reduction (DR) schemes after computing
the dissimilarity matrix with the entire training sam-
ples. Numerous DRs have been proposed in the liter-
ature, some of which are (Belhumeour and Kriegman,
1997), (Yu and Yang, 2001), (Loog and Duin, 2004),
and (Wei and Li, 2009). The most well known DRs
ICAART 2010 - 2nd International Conference on Agents and Artificial Intelligence
236

are the class of linear discriminant analysis (LDA)
strategies, such as Fisher LDA (Yu and Yang, 2001),
Two-stage LDA (Belhumeour and Kriegman, 1997),
Chernoff distance based LDA (Loog and Duin, 2004),
(Rueda and Herrera, 2008), and so on.
In the interest of brevity, the details of the LDA
strategies are again omitted here, but we briefly ex-
plain below the Chernoff distance based LDA (in
short CLDA) that is pertinent to our present study. It
is well-known that LDA is incapable of dealing with
the heteroscedastic data in a proper way (Loog and
Duin, 2004). To overcome this limitation, in CLDA,
the square of Euclidian distance, S
E
= S
B
/(p
1
p
2
), is
replaced with the Chernoff distance defined as: S
C
=
S
−
1
2
(m
1
− m
2
)(m
1
− m
2
)
T
S
−
1
2
+ (logS − p
1
logS
1
−
p
2
logS
2
)/(p
1
p
2
), where S
i
, m
i
, and p
i
are the scat-
ter matrix, the mean vector, and a priori probability
of class i, respectively; S = p
1
S
1
+ p
2
S
2
. Using S
C
,
instead of S
E
, the Fisher separation criterion, J
H
, can
be defined (see Eq. (5) of (Loog and Duin, 2004)).
To obtain a matrix, A, that maximizes J
H
, recently,
some researchers (Rueda and Herrera, 2008) have
developed a gradient-based algorithm named Cher-
noff LDA Two, which consists of three steps: (a) initi-
ate A
(0)
, (b) compute A
(k+1)
from A
(k)
by applying the
secant method to J
H
, and (c) terminate the iteration by
checking the convergence (Rueda and Herrera, 2008).
DBCs, in which the dimensionality of dissimilar-
ity matrices is reduced with a DR, are referred to as
DR-based DBCs or DR-based methods. An algorithm
for DR-based DBCs is summarized in the following:
1. Select the entire training samples T as the rep-
resentative set Y.
2. Using Eq. (1), compute the dissimilarity ma-
trix, D
T,T
[·,·], in which each individual dissimilarity
is computed on the basis of the measures described
in (Pekalska and Duin, 2005). After computing the
D
T,T
[·,·], reduce its dimensionality by invoking a di-
mensionality reduction scheme.
3. This step is the same as in PS-based DBC.
4. This step is the same as in PS-based DBC.
The rationale of this strategy is presented in a later
section together with the experimental results.
In the attempt to provide a comparison between
PS-based DBCs and DR-based DBCs, we are re-
quired to analyze their computational complexities.
In light of brevity, the details of the analysis are omit-
ted here. From analyzing the algorithms, however, we
can observe that the time complexities of PS-based,
LDA (and PCA)-based, and CLDA-based DBCs are
O(nmd), O(n
2
d), and O(n
2
d + n
3
), respectively.
3 EXPERIMENTAL RESULTS
Experimental Data. PS-based and DR-based meth-
ods were tested and compared with each other by con-
ducting experiments for a handprinted character data
set and a well-known face database, namely Nist38
(Wilson and Garris, 1992) and Yale (Georghiades and
Kriegman, 2001). The data set captioned Nist38 con-
sists of two kinds of digits, 3 and 8, for a total of 1000
binary images. The size of each image is 32× 32 pix-
els, for a total dimensionality of 1024 pixels. The
Yale database contains 165 gray scale images of 15
individuals. The size of each image is 243× 320 pix-
els, for a total dimensionality of 77760 pixels. To
reduce the computational complexity of this experi-
ment, facial images of Yale were down-sampled into
178 × 236 pixels and then represented by a centered
vector of normalized intensity values.
Experimental Method. All of our experiments were
performed with a “leave-one-out” strategy; to classify
an image, we removed the image from the training set
and computed the dissimilarity matrix with the n− 1
images. This process was repeated n times for every
image, and a final result was obtained by averaging
the results of each image.
To measure the dissimilarity between two objects,
we used Euclidean distance (ED), Hamming distance
(HD), regional distance (RD) (Adini and Ullman,
1997), and spatially weighted gray-level Hausdorff
distance (WD) (Kim, 2006) measuring systems
2
.
To construct the dissimilarity matrix, in PS-based
methods, we employed Random (in short Rand), Ran-
dom C (in short RandC), KCentres (in short KCen-
ter), and ModeSeek (in short ModeS) to select the
prototype subset. Here, the number of prototypes se-
lected was heuristically determined as c or 2c.
On the other hand, in DR-based methods, to re-
duce the dimensionality, we used direct LDA (in short
LDA), PCA, two-stage LDA (in short PCALDA), and
Chernoff distance-based LDA (in short CLDA). In
addition, to select the dimensions for the systems,
we used the cumulative proportion, α, which is de-
fined as follows (Laaksonen and Oja, 1996): α(q) =
∑
q
j=1
λ
j
.
∑
d
j=1
λ
j
. Here, the subspace dimension,
q, (where d and λ
j
are the dimensionality and the
eigenvalue, respectively) of the data sets is deter-
mined by considering the cumulativeproportionα(q).
The eigenvectors and eigenvalues are computed, and
the cumulative sum of the eigenvalues is compared
to a fixed number, k. In other words, the subspace
2
In this experiment, we employed only four measuring
systems, namely ED, HD, RD, and WD. However, other
numerous solutions could also be considered.
ON REDUCING DIMENSIONALITY OF DISSIMILARITY MATRICES FOR OPTIMIZING DBC - An Experimental
Comparison
237
dimensions are selected by considering the relation
α(q) ≤ k ≤ α(q + 1). In PCALDA, however, we re-
duced the dimensions in two steps: we first reduced
the dimension d(= n− 1) into an intermediate dimen-
sion n− c+ 1 using PCA; we then reduced the inter-
mediate dimension n− c+ 1 to q using LDA
3
.
To maintain the diversityamong the DBCs, we de-
signed different classifiers, such as k-nearest neighbor
classifiers (k = 1), nearest mean classifiers, regular-
ized normal density-based linear/quadratic classifiers,
and support vector classifiers. All of the DBCs men-
tioned above are implemented with PRTools
4
and de-
noted in the next section as knnc, nmc, ldc, qdc, and
svc, respectively. Here, ldc and qdc are regularized
with (R, S) = (0.01,0.01). Also, svc is implemented
using a polynomial kernel function of degree 1.
Experimental Results. The run-time characteristics
of the empirical evaluation on the two data sets are re-
ported below and shown in figures and tables. In this
section, we first investigate the rationality of employ-
ing a PS (i.e., KCenter) or a DR(i.e., PCA) methods in
reducing the dimensionality. Then, we present classi-
fication accuracies of the PS and DR-based methods.
Consequently, based on the classification results, we
grade and rank the methods. Finally, we introduce a
numerical comparison of the processing CPU-times.
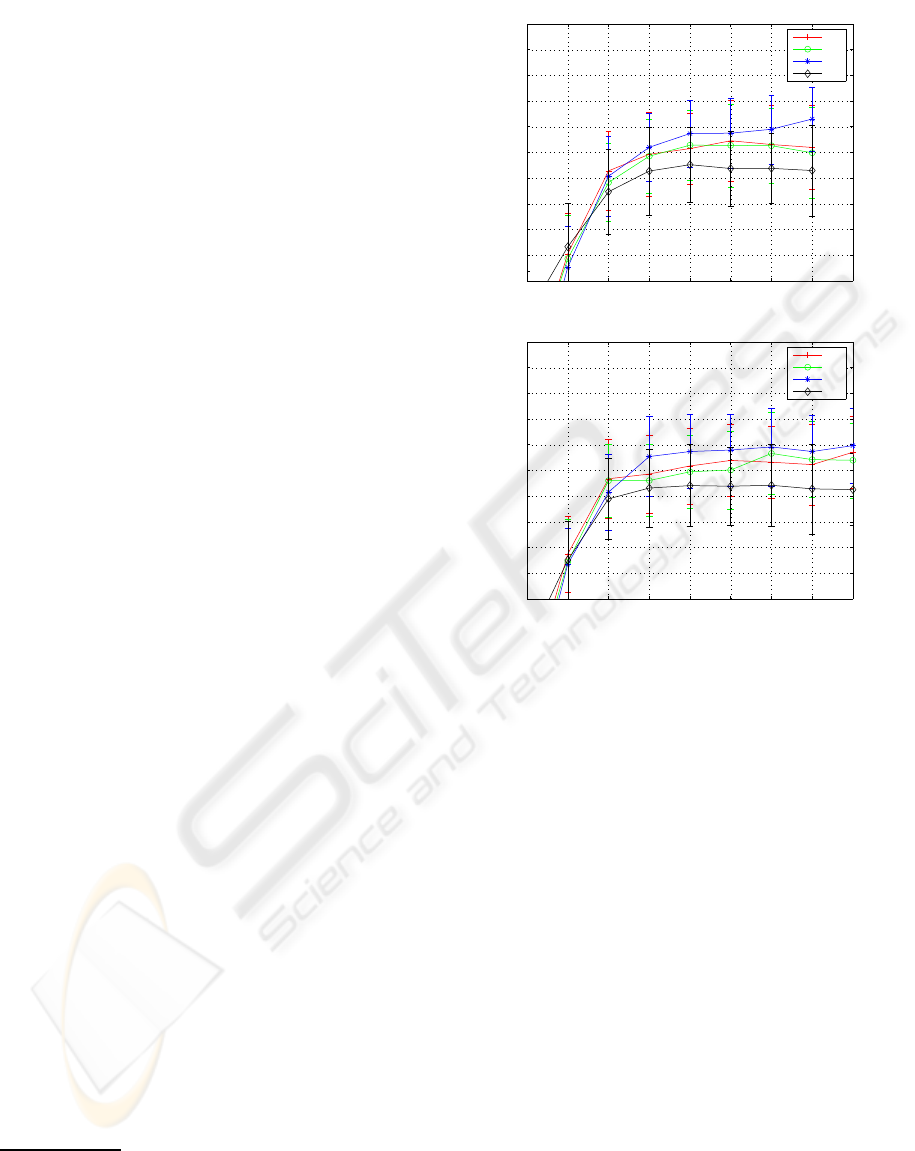
First, the experimentalresults of PS and DR-based
methods were probed. Fig. 1 shows plots of the clas-
sification accuracies obtained with knnc for Yale. In
Fig. 1(a), the dissimilarity matrix, in which the classi-
fiers were evaluated, was generated with the prototype
subset selected with a PS, such as KCenter. In Fig.
1(b), on the other hand, after generating the dissimi-
larity matrix with the entire data set, the dimensional-
ity was reduced by invoking a DR, such as PCA.
In the figure, it is interesting to note that PS and
DR-based DBCs (knnc) can be optimized by means of
choosing the number of prototypes and reducing the
dimensions, respectively. For example, both classifi-
cation accuracies of RD for knnc are saturated when
having 16 and 8 as the number of prototypes and the
subspace dimension, respectively. Here, the prob-
lem to be addressed is how to choose the optimal
number of prototypes and the dimension to be re-
duced. In PS-based methods, we selected the num-
ber of prototypes as 2c (which is an experimental pa-
rameter). In DR-based methods, on the other hand,
using the cumulative technique, we chose the sub-
space dimensions for Yale and Nist38 as follows: (1)
3
Similar to the approaches with prototype selection
methods, the number of dimensions is not given beforehand.
From this point of view, we could say that the problem of
selecting the optimal dimension remains unresolved.
4
http://prtools.org/
1 2 4 8 16 32 64 128 256
50
55
60
65
70
75
80
85
90
95
100
knnc
# of prototypes
Classification accuracies (%)
ED
HD
RD
WD
1 2 4 8 16 32 64 128 256
50
55
60
65
70
75
80
85
90
95
100
knnc
Dimensions
Classification accuracies (%)
ED
HD
RD
WD
Figure 1: Plots of the classification accuracy rates (%) of
PS-based and DR-based DBCs (knnc) for Yale database: (a)
top (PS-based DBC); (b) bottom (DR-based DBC). Here,
the prototype subsets of (a) are selected from the training
data set with KCenter and the subspace dimensions of (b)
are obtained (selected) with a PCA.
Yale: q
WD
= 12; q
RD
= 15; q
ED
= 76; q
HD
= 133, (2)
Nist38: q
WD
= 133; q
RD
= 22; q
ED
= 41; q
HD
= 41.
Although it is hard to quantitatively evaluate the
various PS and DR-based methods, we have at-
tempted to do exactly this; we have given a numer-
ical grade to every method tested here according to
its classification accuracy to render this comparative
study more complete. Tables 1 and 2 show, respec-
tively, the classification accuracies of PS and DR-
based DBCs, where the values underlined are the
highest ranks in the four accuracies of each classifier.
From the two tables, we can see that almost all the
highest rates (underlined) achieved with DR-based
DBCs are higher than those of PS-based ones. This
observation confirms the possibility that the classifi-
cation performance of DBCs can be improved by ef-
fectively reducing the dimensionality after construct-
ing dissimilarity matrices with all of the training sam-
ples. To observe how well the methods work, we
picked the best three among the eight (four of PSs and
ICAART 2010 - 2nd International Conference on Agents and Artificial Intelligence
238

Table 1: Classification accuracies (%) of PS-based DBCs.
data methods knnc nmc ldc qdc svc
Rand 80.00 77.58 84.24 75.76 84.85
ED RandC 80.61 81.82 96.97 79.39 56.97
KCenter 77.58 80.00 89.70 75.76 85.45
ModeS 78.18 78.79 88.48 76.36 89.09
Rand 75.15 73.94 71.52 76.36 76.36
Yale HD RandC 75.76 80.00 89.70 73.33 75.76
KCenter 73.94 74.55 76.97 75.15 80.61
ModeS 75.15 78.18 75.76 80.00 87.88
Rand 77.58 71.52 90.91 76.36 86.06
RD RandC 78.79 70.91 98.79 75.15 86.67
KCenter 78.79 76.97 96.97 76.36 86.67
ModeS 79.39 74.55 97.58 76.36 89.09
Rand 72.12 52.12 80.00 71.52 78.79
WD RandC 71.52 49.09 79.39 70.91 76.36
KCenter 74.55 49.70 79.39 70.30 76.36
ModeS 71.52 49.09 76.97 69.70 74.55
Rand 79.10 77.10 80.80 82.00 71.10
ED RandC 90.40 84.90 90.00 91.00 89.10
KCenter 80.00 79.50 83.60 84.80 76.80
ModeS 97.40 85.40 97.80 99.30 96.50
Rand 80.70 80.20 82.70 84.00 81.70
Nist38 HD RandC 90.00 82.00 88.50 90.00 86.80
KCenter 81.30 78.30 83.00 84.00 73.60
ModeS 97.40 85.40 97.80 99.30 97.80
Rand 84.50 80.70 86.30 85.70 0
RD RandC 93.80 85.10 91.60 93.00 0
KCenter 90.80 86.40 91.10 91.40 90.90
ModeS 97.00 86.90 97.80 98.90 97.70
Rand 78.90 70.50 77.10 78.50 75.10
WD RandC 87.40 73.90 84.40 86.60 80.80
KCenter 79.90 74.70 79.70 81.80 64.00
ModeS 93.70 77.50 95.50 96.80 95.20
Table 2: Classification accuracies (%) of DR-based DBCs.
data methods knnc nmc ldc qdc svc
LDA 89.70 93.94 93.94 83.03 89.70
ED PCA 79.39 80.61 93.94 79.39 46.67
PCALDA 90.30 92.73 89.09 83.64 96.97
CLDA 89.70 89.70 91.52 82.42 93.33
LDA 82.42 81.21 81.21 79.39 84.85
Yale HD PCA 75.76 77.58 86.67 78.79 89.70
PCALDA 79.39 84.24 80.00 72.12 87.88
CLDA 81.21 81.21 81.21 76.36 89.70
LDA 90.91 96.97 96.97 84.24 94.55
RD PCA 79.39 75.15 96.97 77.58 86.06
PCALDA 98.79 98.79 93.33 89.70 99.39
CLDA 89.09 89.09 87.88 71.52 81.21
LDA 80.00 83.03 83.03 73.33 77.58
WD PCA 70.91 49.70 72.73 70.91 73.33
PCALDA 75.76 76.97 70.91 60.61 63.03
CLDA 64.24 64.24 60.00 48.48 42.42
LDA 84.80 87.50 87.50 87.80 87.00
ED PCA 98.10 87.50 98.00 99.30 96.60
PCALDA 71.50 71.60 71.60 70.80 71.40
CLDA 63.80 63.80 63.80 80.10 63.80
LDA 84.80 87.50 87.50 87.80 87.00
Nist38 HD PCA 98.10 87.50 98.00 99.30 97.70
PCALDA 71.50 71.60 71.60 70.80 0
CLDA 63.80 63.80 63.80 80.10 63.80
LDA 86.90 88.30 88.20 88.90 85.60
RD PCA 97.30 88.20 97.10 98.60 0
PCALDA 58.10 58.10 58.10 58.00 0
CLDA 50.40 50.40 49.10 49.50 50.40
LDA 68.00 76.90 76.90 77.30 76.20
WD PCA 92.50 76.90 97.00 97.00 96.30
PCALDA 55.80 55.80 55.80 55.70 0
CLDA 52.70 52.70 50.10 59.60 52.70
four of DRs) methods per each classifier and ranked
them in the order from the highest to the lowest clas-
sification accuracies. Although this comparison is a
very simplistic model of comparison, we believe that
it is the easiest approach a researcher can employ
when dealing with algorithms that havedifferent char-
acteristics.
From the rankings obtained from Tables 1 and 2,
we can clearly observe the possibility of improving
the performance of DBCs by utilizing the DRs. In
most instances, the averaged classification accuracies
of DR-based DBCs are increased compared to those
of PS-based ones (note that almost all of the highest
rankings are those of DR-based methods.) However,
some DR-based DBCs failed to improve their clas-
sification accuracies
5
. From this consideration, we
can see that it is difficult for us to grade the meth-
ods as they are. Therefore, for simple comparisons,
we first assigned marks of 3, 2, or 1 to all DR and
PS methods according to their ranks; 3 marks are
given to the 1
st
rank; 2 marks for the 2
nd
, and 1
mark for the 3
rd
. Then, we added up all the marks
that each method earned with the five classifiers and
the four measuring methods. For example, the marks
that LDA gained in ED, HD, RH, and WD rows
are 10(= 2 + 3 + 2 + 2 + 1), 8(= 3 + 2 + 1 + 2 + 0),
9(= 2+2+1+2+2),and 14(= 3+3+3+3+2),re-
spectively. Thus, the total mark that the LDA earned
is 41. Using the same system, we graded all the other
DR (and PS) methods, and, as a final ranking, we ob-
tained the followings:
(1) For Yale, 1
st
: LDA (41); 2
nd
: PCALDA (32);
3
rd
: CLDA (17).
(2) For Nist38, 1
st
: PCA (51); 2
nd
: ModeS (45);
3
rd
: RandC (14).
Here, the number (·) of each DR (or PS) method
represents the final grade it obtained. From this rank-
ing, we can see that all of the highest ranks are of DR
methods. Thus, in general, it should be mentioned
that more satisfactory optimization of DBCs can be
achieved by applying a DR after building the dissim-
ilarity space with all of the available samples rather
than by selecting the representative subset from them.
As analyzed in Section 2, choosing the entire
training set as the representative prototypes leads to
higher computational complexity as more distances
have to be calculated. In comparing PS-based and
DR-based methods, we simply measured the process-
ing CPU-times (seconds) of the DBCs designed with
the two databases. In the interest of space, the de-
tails of the measured times are omitted here. From the
measures, however, we can observe that the process-
ing CPU-times increased when DR-based methods
were applied. An instance of this change is the pro-
cessing times of ED for Yale. The processing times
of LDA, PCA, PCALDA, and CLDA methods are, re-
spectively, 0.0250, 0.2161, 0.2521, and 27.9266 (sec-
onds), while those of Rand, RandC, KCenter, and
ModeS are, respectively, 0.0182, 0.0099, 0.0870, and
5
For this failure, we are currently investigating why it
occurs and what the cause is.
ON REDUCING DIMENSIONALITY OF DISSIMILARITY MATRICES FOR OPTIMIZING DBC - An Experimental
Comparison
239

0.0141 (seconds). The same characteristic could also
be observed in HD, RD, and WD methods. In light
of brevity, the results of the others are omitted here
again. However, it is interesting to note that the pro-
cessing time of CLDA increases radically as the num-
ber of samples increases.
In review, the experimental results show that when
the DR-based method is applied to the dissimilarity
representation, the classification accuracy of the re-
sultant DBCs increases, but so does the processing
CPU-time. In addition, in terms of the classification
accuracies, the DR-based method is more useful for
the nonparametric classifiers, such as knnc and nmc,
but not for the parametric ones, such as ldc and qdc.
4 CONCLUSIONS
In this paper, we performed an empirical comparison
of PS-based and DR-based methods for optimizing
DBCs. DBCs designed with the two methods were
tested on the well-known benchmark databases, and
the classification accuracies obtained were compared
with each other. Our experimental results demon-
strate that DR-based method is generally better than
PS-based methods in terms of classification accuracy.
Especially, the DR-based method is more useful for
the nonparametric classifiers, but not for the paramet-
ric ones. Despite this success, problems remain to be
addressed. First, in this evaluation, we employed a
very simplistic model of comparison. Thus, develop-
ing a more scientific model, such as the one in (Sohn,
1999), is an avenue for future work. Next, the classifi-
cation accuracy of DR-based DBCs increases, but so
does the processing CPU-time. To solve this problem,
therefore, developing a new dimensionality reduction
scheme in the dissimilarity space is required. Future
research will address these concerns.
REFERENCES
Adini, Y. Moses, Y. and Ullman, S. (1997). Face recog-
nition: The problem of compensating for changes in
illumination direction. IEEE Trans. Pattern Anal. and
Machine Intell., 19(7):721–732.
Belhumeour, P. N. Hespanha, J. P. and Kriegman, D. J.
(1997). Eigenfaces vs. fisherfaces: Recognition using
class specific linear projection. IEEE Trans. Pattern
Anal. and Machine Intell., 19(7):711–720.
Bicego, M. Murino, V. and Figueiredo, M. A. T. (2004).
Smilarity-based classification of sequences using hid-
den markov models. Pattern Recognition, 37:2281–
2291.
Bunke, H. and Riesen, K. (2007). A family of novel graph
kernels for structural pattern recognition. Lecture Note
in Computer Science, 4756:20–31.
Georghiades, A. S. Belhumeur, P. N. and Kriegman, D. J.
(2001). From few to many: Illumination cone mod-
els for face recognition under variable lighting and
pose. IEEE Trans. Pattern Anal. and Machine Intell.,
23(6):643–660.
Kim, S. W. (2006). Optimizing dissimilarity-based classi-
fiers using a newly modified hausdorff distance. Lec-
ture Note on Artificial Intelligence, 4303:177–186.
Kim, S. W. and Gao, J. (2008). On using dimensionality re-
duction schemes to optimize dissimilarity-based clas-
sifiers. Lecture Note in Computer Science, 5197:309–
316.
Kim, S. W. and Oommen, B. J. (2007). On using pro-
totype reduction schemes to optimize dissimilarity-
based classification. Pattern Recognition, 40:2946–
2957.
Laaksonen, J. and Oja, E. (1996). Subspace dimension
selection and averaged learning subspace method in
handwritten digit classification. In Proceedings of
ICANN, pages 227–232, Bochum, Germany.
Loog, M. and Duin, R. P. W. (2004). Linear dimension-
ality reduction via a heteroscedastic extension of lda:
The cherno criterion. IEEE Trans. Pattern Anal. and
Machine Intell., 26(6):732–739.
Pekalska, E. and Duin, R. P. W. (2005). The Dissimilarity
Representation for Pattern Recognition: Foundations
and Applications. World Scientific Pub., Singapore.
Pekalska, E. Duin, R. P. W. and Paclik, P. (2006). Proto-
type selection for dissimilarity-based classifiers. Pat-
tern Recognition, 39:189–208.
Riesen, K. Kilchherr, V. and Bunke, H. (2007). Reduc-
ing the dimensionality of vector space embeddings
of graphs. Lecture Note on Artificial Intelligence,
4571:563–573.
Rueda, L. and Herrera, M. (2008). Linear dimensional-
ity reduction by maximizing the chernoff distance in
the transformed space. Pattern Recognition, 41:3138–
3152.
Sohn, S. Y. (1999). Meta analysis of classification algo-
rithms for pattern. IEEE Trans. Pattern Anal. and Ma-
chine Intell., 21(11):1137–1144.
Wei, C., L. Y. C. W. and Li, C. (2009). Trademark im-
age retrieval using synthetic features for describing
global shape and interior structure. Pattern Recogni-
tion, 42:386–394.
Wilson, C. L. and Garris, M. D. (1992). Handprinted Char-
acter Database 3. National Institute of Standards and
Technology, Gaithersburg, Maryland.
Yu, H. and Yang, J. (2001). A direct lda algorithm for high-
dimensional data - with application to face recogni-
tion. Pattern Recognition, 34:2067–2070.
ICAART 2010 - 2nd International Conference on Agents and Artificial Intelligence
240
