
FEATURE RELEVANCE ASSESSMENT IN AUTOMATIC
INTER-PATIENT HEART BEAT CLASSIFICATION
G. de Lannoy
1,2
, D. Franc¸ois
1
, J. Delbeke
2
and M. Verleysen
1
1
Machine Learning Group, Universit
´
e catholique de Louvain
pl. du Levant 3, 1348 Louvain-la-Neuve, Belgium
2
Departement of physiology and pharmacology, Universit
´
e catholique de Louvain
av. Hippocrate 54, 1200 Bruxelles, Belgium
Keywords:
Heart beat classification, AAMI standards, Support vector machines, Unbalanced data, Feature selection,
Inter-patient classification.
Abstract:
Long-term ECG recordings are often required for the monitoring of the cardiac function in clinical applica-
tions. Due to the high number of beats to evaluate, inter-patient computer-aided heart beat classification is of
great importance for physicians. The main difficulty is the extraction of discriminative features from the heart
beat time series. The objective of this work is the assessment of the relevance of feature sets previously pro-
posed in the literature. For this purpose, inter-patient classification of heart beats following AAMI guidelines
is investigated. The class unbalance is taken into account by using a support vector machine (SVM) classifier
that integrates distinct weights for the classes. The performances of the SVM model with an appropriate selec-
tion of features are better than those of previously reported inter-patient classification models. These results
show that the choice of the features is of major importance, and that some usual feature sets do not serve the
classification performances. In addition, the results drop significantly when the class unbalance is not taken
into account, which shows that this issue must be addressed to grasp the importance of the pathological cases.
1 INTRODUCTION
The analysis of the electrocardiogram (ECG) signal
provides critical information on the cardiac function
of patients. Long-term recordings of the ECG signal
are, for example, required for the clinical diagnosis
of some disease conditions, and for the evaluation of
new drugs during phase-one studies by pharmaceu-
tical groups. Such long-term recordings are usually
obtained using the popular Holter recorders.
These systems are ambulatory heart activity
recording units delivering signal storing capabilities
ranging from 24 to 48 hours and thus providing with
data of hundreds to thousands of heart beats. The
analysis is usually performed off-line by cardiolo-
gists, whose diagnosis may rely on just a few transient
patterns. Due to the high number of beats to evalu-
ate, this task is very expensive and reliable visual in-
spection is difficult. Computer-aided classification of
pathological beats is therefore of great importance.
However, this is a difficult task in real situations.
First, several sources of noise pollute the ECG signal.
Among these, power line interferences, muscular arti-
facts, poor electrode contacts and baseline wandering
due to respiration can sometimes be identified. Sec-
ond, the classes are very unbalanced since a vast ma-
jority of the heart beats are normal healthy beats and
just a small number of beats are pathological, though
those are of major importance. Third, artificial intel-
ligence methods require the extraction of discrimina-
tive features from the heart beat time series. The ex-
traction of the information available in the ECG signal
into a set of relevant features requires proper expertise
because it is difficult and crucial.
Computer-aided heart beat classification has been
addressed previously in the literature. Several fea-
tures characterizing the heart beats and several classi-
fication models have been investigated (Clifford et al.,
2006). However, very few reported works follow
the standards defined by the American Association
for Medical Instrumentation (AAMI), which makes it
very difficult to assess the relative merits of the meth-
ods and of the proposed extracted features (Associa-
tion for the Advancement of Medical Instrumentation,
1998). Also, the unbalanced classes issue is usually
not taken into account.
13
de Lannoy G., François D., Delbeke J. and Verleysen M. (2010).
FEATURE RELEVANCE ASSESSMENT IN AUTOMATIC INTER-PATIENT HEART BEAT CLASSIFICATION.
In Proceedings of the Third International Conference on Bio-inspired Systems and Signal Processing, pages 13-20
DOI: 10.5220/0002690900130020
Copyright
c
SciTePress

Furthermore, most of proposed methods require
labeled beats from the tested patient in the training
of the model and actually perform what could be re-
ferred to as “intra-patient” classification. By con-
trast, “inter-patient” classification consists in classi-
fying the beats of a new tested patient according to a
reference database built from data coming from other
patients. This is a much harder task of generalization
but it is also much more useful since labeled beats
from a new patient are usually not timely available in
real situations.
In this work, inter-patient classification of heart
beats following the AAMI guidelines is investigated.
First, the class unbalance is taken into account by us-
ing a support vector machine classifier that integrates
distinct weights for the classes depending on their pri-
ors. Second, a large number of distinct features pro-
posed in the literature are combined and evaluated,
and a discussion is made about the relevance of each
type of features.
The following of this paper is organized as fol-
lows. Section 2 briefly reviews the state of the art in
heart beat classification. Section 3 provides a short
overview of the theoretical background for the math-
ematical methods used in this work. Section 4 de-
scribes the methodology followed by the experiments
and Section 5 presents the results.
2 STATE OF THE ART
This section provides a short review of the state of the
art in supervised heart beat classification. Two kinds
of heart beat classification paradigms can be distin-
guished, corresponding to either intra-patient classi-
fication or inter-patient classification.
Inter-patient classification consists in classifying
the beats of a new tested patient according to a refer-
ence database and a model built from data from other
patients. This process thus implies generalization
from one patient to another. As far as intra-patient
classification is concerned, the reference database
must contain previously labeled beats from the tested
patient. The results that can be achieved are natu-
rally better than when inter-patient classification is
performed, but the patient labeled beats are usually
not available in real situations. Furthermore, because
pathological beats can be very rare, there is no guar-
antee that the few training beats that would be labeled
for this patient would contain representatives for each
class; and the classifier could possibly fail in predict-
ing something it has not learned.
Despite these major drawbacks, the majority of
previously reported work is about intra-patient classi-
fication. Different models have been proposed for this
task, including neural networks (Osowski and Hoai,
2001), k-nearest neighbors (Christov et al., 2006),
hidden Markov models (Cheng and Chan, 1998) and
support vector machines (Melgani and Bazi, 2008). A
comprehensive review of intra-patient classification
methods and their results can be found in (Clifford
et al., 2006).
As far as inter-patient classification is concerned,
the first study to establish a reliable inter-patient clas-
sification methodology following AAMI standards is
(Chazal et al., 2004). A linear discriminant analy-
sis (LDA) classifier model is trained and the results
are evaluated on an independent test set. The un-
balanced classes issue is addressed by introducing
weights in the linear discriminant functions. In (Park
et al., 2008), these classification results are improved
on the same dataset using SVM and other features.
Hierarchical SVMs are used to reduce the effect of
unbalanced classes.
The classification performances heavily rely on
the extraction of relevant features from the heart beat
time series. A variety of features have been proposed
to characterize the heart beats. The representation of
the heart beat signal by the coefficients of Hermite ba-
sis functions expansions is introduced for a clustering
application in (Lagerholm et al., 2000), and later used
for classification by (Osowski et al., 2004) and (Park
et al., 2008). Another type of features that has been
proposed is the representation of the heart beats by
higher order statistics, and in particular the cumulants
of order 2, 3 and 4 (Osowski and Hoai, 2001).
Another widely used group of features is mor-
phological features (latter referred to as segmenta-
tion features) (Christov et al., 2006; Chazal et al.,
2004). These features require the annotation of
PQRST waves and then summarize the morphology
of the heart beat series by their duration, area, Q-T
intervals, S-T intervals, the height of the QRS com-
plex, etc. In most of previously reported works, the
successive time differences between the R spikes of
heart beats (later referred to as R-R intervals) are al-
ways combined to the other features. However, the
intrinsic relevance of each type of features remains
unknown. In this paper, this relevance is investigated
using feature selection techniques (Franc¸ois, 2008;
Guyon et al., 2006).
3 THEORETICAL BACKGROUND
This section provides a brief theoretical background
on mathematical methods that are used in this work.
BIOSIGNALS 2010 - International Conference on Bio-inspired Systems and Signal Processing
14

3.1 Support Vector Machines
A support vector machine (SVM) is a supervised
learning method that was first introduced by Vap-
nik (Vapnik, 1999). The two-classes case is de-
scribed here, because its extension to multiple classes
is straightforward by applying the one-against-all or
one-against-one methods. Let us first define the p di-
mensional feature vector x
k
= {x
1
k
,x
2
k
,...,x
p
k
} and the
associated class value y
k
∈ {−1, 1} for a given heart
beat k with k ranging from 1 to K, K being the total
number of heart beats.
SVMs are linear machines that rely on a prepro-
cessing to represent the features in a higher dimen-
sion, typically much higher than the original feature
space. With an appropriate non-linear mapping ϕ(x)
to a sufficiently high dimensional space, finite data
from two categories can always be separated by a hy-
perplane. In SVMs, this hyperplane is chosen as the
one with the largest margin.
Assume each observation x
k
has been transformed
to z
k
= ϕ(x
k
). The equation of the hyperplane in
the augmented space is defined as g(z) = a
t
z where
both the weight and the transformed pattern vectors
are augmented by a
0
= w
0
and z
0
= 1 respectively. A
separating hyperplane thus ensures that
y
k
g(z
k
) ≥ 1 k = 1,...,K. (1)
The distance from any hyperplane to a trans-
formed pattern z is |g(z)|/||a||, and Eq. 1 implies that
y
k
g(z
k
)
||a||
≥ b k = 1, . . . , K (2)
where it is assumed that b is an existing positive mar-
gin. The objective is then to find the weight vector
a that maximizes b. As the solution vector can be
scaled arbitrarily, the constraint b||a|| = 1 is usually
imposed, which is equivalent to minimizing ||a||
2
. By
constructing the Lagrangian, this primal optimization
can be reformulated in a so-called dual form that max-
imizes
L(α) =
K
∑
k=1
α
k
−
1
2
K
∑
k=1
K
∑
j=1
α
k
α
j
y
k
y
j
z
t
k
z
j
, (3)
with respect to the Lagrange multipliers α
k
associated
to inequalities 1, subject to the constraints
K
∑
k=1
y
k
α
k
= 0 0 ≤ α
k
≤C (4)
where C represents the regularizing parameter and de-
termines the balance between the complexity of the
model and the classification error. These equations
can be efficiently solved using quadratic program-
ming. For this type of optimization, there exist many
highly effective learning algorithms. A common
method for solving the problem is Platt’s Sequen-
tial Minimal Optimization (SMO) algorithm, which
breaks the problem down into 2-dimensional sub-
problems that may be solved analytically, eliminating
the need for a numerical optimization algorithm such
as conjugate gradient methods (Platt, 1999).
In the dual form, the explicit form of the mapping
function ϕ must not be known as long as the kernel
function K(x
i
,x
j
) = ϕ(x
i
)ϕ(x
j
) is defined. The ker-
nel can for example be the linear kernel K(x
i
,x
j
) =
x
t
i
x
j
or the radial basis function kernel K(x
i
,x
j
) =
exp(−γ||x
i
−x
j
||
2
) where γ is a kernel parameter to
be tuned.
3.2 Hermite Basis Functions
The representation of the heart beat signal via Her-
mite basis functions (HBF) was first introduced by
(Lagerholm et al., 2000) for a clustering application
and later by (Osowski et al., 2004) for classifica-
tion. This approach exploits similarities between the
shapes of HBF and typical ECG waveforms. Let us
denote the heart beat signal by x(t). Its expansion into
a Hermite series of order N is written as
x(t) =
N−1
∑
n=0
c
n
φ
n
(t,σ) (5)
where c
n
are the expansion coefficients and σ is the
width parameter. φ
n
(t,σ) are the Hermite basis func-
tions of the nth order defined as follows:
φ
n
(t,σ) =
1
p
σ2
n
n!
√
π
e
−t
2
/2σ
2
H
n
(t/σ) (6)
where H
n
(t/σ) is the Hermite polynomial of the nth
order. The Hermite polynomials satisfy the following
recurrence relation:
H
n
(x) = 2xH
n−1
(x) −2(n −1)H
n−2
(x) (7)
with H
0
(x) = 1 and H
1
(x) = 2x.
The higher the order of the Hermite polynomial,
the higher its frequency of changes in the time do-
main, and the better the capability of the expansion in
Eq. 5 to reconstruct the signal (Clifford et al., 2006).
The width parameter σ can be tuned to provide a good
representation of beats with large differences in dura-
tions. The coefficients c
n
of the HBF expansion can
be estimated by minimizing the sum of squared errors
using singular value decomposition and the pseudo-
inverse technique. These coefficients summarize the
shape of the heart beat signal and can be treated as the
features used in the classification process.
FEATURE RELEVANCE ASSESSMENT IN AUTOMATIC INTER-PATIENT HEART BEAT CLASSIFICATION
15

3.3 Higher Order Statistics
The statistical properties of the heart beat signal can
be represented by its higher order statistics (HOS).
The cumulants of order two, three and four are usu-
ally used (Osowski and Hoai, 2001). Assuming the
heart beat signal x(t) has a zero mean, its cumulant
C
i
x
of order i can be computed as follows:
C
2
x
(τ
1
) = E{x(t)x(t + τ
1
)}
C
3
x
(τ
1
,τ
2
) = E{x(t)x(t + τ
1
)x(t + τ
2
)}
C
4
x
(τ
1
,τ
2
,τ
3
) = E{x(t)x(t + τ
1
)x(t + τ
2
)x(t + τ
3
)}
−C
2
x
(τ
1
)C
2
x
(τ
3
−τ
2
)
−C
2
x
(τ
2
)C
2
x
(τ
3
−τ
1
)
−C
2
x
(τ
3
)C
2
x
(τ
2
−τ
1
)
where E is the expectation operator and τ
1
,τ
2
,τ
3
are
the time lags.
4 METHODOLOGY
Let us assume that a reference database has been ob-
tained and labeled by a cardiologist, with all patholo-
gies of interest being represented. Given a new ECG
signal, for example recorded using an Holter system,
one wants to use the information contained in the ref-
erence database in order to predict the pathologies
present in the new signal.
4.1 ECG Filtering
The filtering procedure defined in (Chazal et al.,
2004) is used in this work. The ECG signal is first fil-
tered by two median filters. The first median filter is
of 200 msec width and removes the QRS complexes
and the P waves. The resulting signal is then pro-
cessed with a second median filter of 600 msec width
to remove the T waves. The signal resulting from the
second filter operation contains the baseline wander-
ings and can be subtracted from the original signal.
Powerline and other high frequency artifacts are then
removed from the baseline corrected signal with a FIR
filter.
4.2 Heart Beat Extraction
Several computer-aided annotation algorithms have
been reported in the literature in order to automati-
cally detect the characteristic points of the ECG (Clif-
ford et al., 2006). The standard ecgpuwave
1
segmen-
1
see http://www.physionet.org/physiotools/software-
index.shtml
tation software provided with the MIT-BIH database
is used to provide estimates of such characteristic
points. Nevertheless, even the best annotation algo-
rithms sometimes fail in detecting the exact beginning
of the beats (the start of the P wave). However, the R
spike has a very high detection rate and can be used
as a more reliable marker. Defining a static window
around the R spike is thus a safer way to separate the
beats without missing a large amount of data. A win-
dow of 250 msec before and after the R position is
used in this work.
4.3 Feature Extraction
Five groups of features are extracted from each heart
beat: R-R intervals, Hermite basis function expansion
coefficients, higher order statistics, segmentation fea-
tures and patient-normalized segmentation features.
1. R-R intervals: This group consists of six features
built from the R-R interval series. The first three
features are the R-R interval to the previous beat,
the R-R interval to the next beat and the average
of R-R intervals in a window of 10 surroundings
beats. The other next three interval features corre-
spond to the ratio between the previous three val-
ues and their mean value for this patient. These
last features are thus independent from the mean
normal behavior of the heart of patients, which
can naturally be very different between individ-
uals, possibly misleading the classifier.
2. Segmentation features: A large variety of 24 fea-
tures are computed from the estimated character-
istic points. Some of these features are a boolean
flag indicating the presence/absence of QRS, P
and T waves. If the waves are present, their dura-
tion, maximum and minimum values, area, stan-
dard deviation, skewness and kurtosis are com-
puted as features. The complete list of segmen-
tation features can be found in (Christov et al.,
2006).
3. HBF coefficients: The parameters for computing
the HBF expansion coefficients as defined in (Park
et al., 2008) are used. The order of the Hermite
polynomial is set to 20, and the width parameter σ
is estimated so as to minimize the reconstruction
error. Figure 1 shows a normal beat and its recon-
struction from the estimated HBF coefficients.
4. Higher order statistics: The 2nd, 3rd and 4th or-
der cumulant functions are computed. The pa-
rameters as defined in (Osowski et al., 2004) are
used: the lag parameters range from -250 msec to
250 msec centered on the R spike and 10 equally
spaced sample points of each cumulant are used as
BIOSIGNALS 2010 - International Conference on Bio-inspired Systems and Signal Processing
16
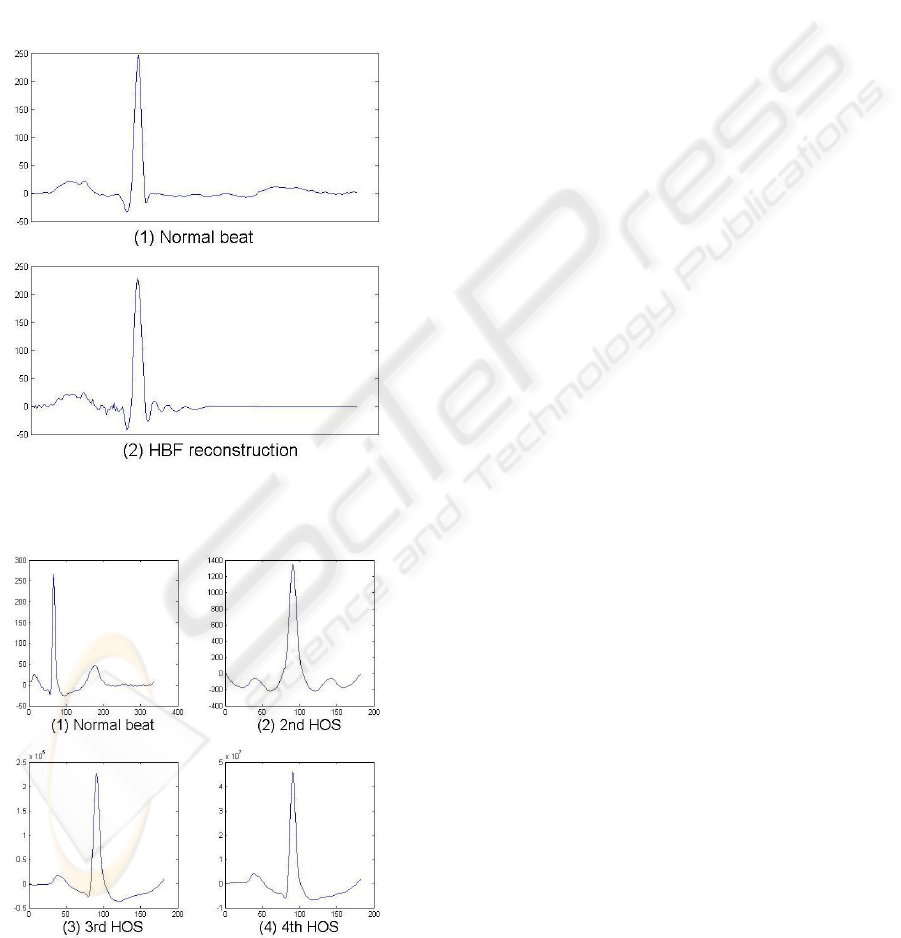
features, for a total of 30 features. Figure 2 shows
an example of cumulants for a normal beat.
5. Patient-normalized segmentation features: This
group of features contains the same features as the
segmentation group, but the values are normalized
by their mean value for each patient. The normal-
ization is obviously not applied to boolean seg-
mentation features. Here again, the objective is
to make each feature independent from the mean
behavior of the heart of a patient, because it can
naturally be very different between individuals.
Figure 1: (1) A normal ECG beat and (2) its reconstruction
from HBF coefficients.
Figure 2: (1) A normal ECG beat (2) its cumulant of the 2nd
order (3) its cumulant of the third order and (4) its cumulant
of the fourth order.
4.4 Classification Model
Classification models based on SVMs with the one-
against-one multi-class strategy are considered in this
study. The training of the model is performed on a ref-
erence database, and this model is then applied to get
a prediction of the class label of new heart beats from
another patient. Several types of kernels are evaluated
in this study, and the linear kernel always outperforms
the other kernels. As this is in accordance with pre-
vious works on heart beat classification using SVMs
(Park et al., 2008), only the results with the linear ker-
nel are reported here.
The relative proportions of the classes of the avail-
able training examples influence dramatically the per-
formances of the SVM classifier. If a few number of
classes dominates the training data, the performances
of SVM drop significantly (Yinggang and Qinming,
2006). One solution to this problem is to randomly
downsample the larger classes, but this results in a
waste of potentially useful data. A better solution fol-
lowed in this work is to include all training examples
but reduce the contribution of dominating classes in
the training process.
This is achieved by weighting the parameter C of
class i in Eq. 4 to w
i
C. The problem is to find the opti-
mal w
i
values. In a two-class problem, it can easily be
estimated by cross-validation. In a multi-class prob-
lem, this is much more difficult; in our experiments
these values are set according to the prior probabili-
ties of each class in the training data. Let us define
n
i
, the number of beats in class i. The weight associ-
ated to each class i is then set as w
i
= n
i
/N where N
is the total number of beats. Intuitively, the addition
of weights in the classifier for small classes means
that more attention is given to pathological classes
and less to normal beats. This is in accordance with
doctors who clearly prefer that a healthy patient is
wrongly diagnosed ill rather than an ill patient is di-
agnosed healthy and left untreated.
4.5 Performance Evaluation
In a heart beat classification task, around 90% of beats
are normal beats and a dummy classifier which would
always predicting the normal class would get 90% ac-
curacy. For this reason, it is important to look at class
accuracies separately and to use the average of these
class accuracies as performance measure rather than
considering the overall classification accuracy.
FEATURE RELEVANCE ASSESSMENT IN AUTOMATIC INTER-PATIENT HEART BEAT CLASSIFICATION
17

Table 1: Grouping of the MIT-BIH labeled heart beat types according to the AAMI standards.
Normal beats (N) Supraventricular ectopic
beats (S)
Ventricular ectopic beats
(V)
Fusion beats (F)
Normal beats Atrial premature beat Premature ventricular
contraction
Fusion of ventricular and
normal beats
Left bundle branch block
beats
Aberrated atrial prema-
ture beat
Ventricular escape beats
Right bundle branch
block beats
Nodal (junctional) pre-
mature beats
Atrial escape beats Supraventricular prema-
ture beats
Nodal (junctional) es-
pace beats
5 EXPERIMENTS AND RESULTS
Data from the MIT-BIH arrhythmia database (Gold-
berger et al., 2000) are used in our experiments.
The database contains 48 half-hour long ambulatory
recordings obtained from 48 patients, for a total of ap-
proximatively 110’000 heart beats labeled into 15 dis-
tinct types. Following the AAMI recommendations,
the four recordings with paced beats are rejected and
the MIT-BIH labeled types are then grouped into four
more clinically relevant heart beat classes (Associa-
tion for the Advancement of Medical Instrumentation,
1998) (see Table 1 for grouping details):
N-class includes beats originating in the sinus node
(normal and bundle branch block beat types);
S-class includes supraventricular ectopic beats;
V-class includes ventricular ectopic beats (VEBs);
F-class includes beats that result from fusing normal
and VEBs.
The dataset configuration is the same as in (Chazal
et al., 2004; Park et al., 2008). The 44 available
recordings are divided in two independent datasets of
22 recordings each with approximatively the same ra-
tio of heart beats classes. The first dataset is the train-
ing set, and is used to build the model. The second
dataset is the test set, and is used to obtain an inde-
pendent measure of the performances of the classifier.
Table 2 shows the number of beats in each class and
their frequencies in the two datasets.
All features introduced in Section 4.3 are com-
puted and all the possible combinations of the five
feature groups are evaluated with the weighted SVM
model, for a total of 31 configurations. Table 3 holds
the most interesting results out of the 31 configura-
tions, together with the results of previously reported
models that also followed AAMI guidelines and inter-
patient classification. The best and worst results of
the SVM model when no weights are defined (“raw”
models) are also shown in the table.
The most remarkable observation is that when R-
R features are not included in the model, is has been
impossible to obtain more than 55.4% of mean accu-
racy. The other feature groups, when included alone
in the model, always lead to an accuracy below 50%.
Best overall performances are obtained with the
combination of R-R intervals and segmentation fea-
tures with 83.0% accuracy. The addition of any other
features to this selection always leads to a lower accu-
racy. In particular, the normalization of the segmen-
tation features with respect to each patient provides a
lower accuracy when these features are coupled with
R-R intervals than when their non normalised version
is used. It is also interesting to note that R-R interval
features yield 80.8% of accuracy by themselves and
are clearly the most important features to include in
the model.
The weights included in the SVM to take the un-
balanced class ratio into account are also of major im-
portance. If no weights are defined, the best average
accuracy that can be obtained by the SVM model de-
creases to 54.3%, with an accuracy of only 7.4% for
class S and of 33.0% for class F which is clearly un-
acceptable.
The weighted SVM model with the best selection
(or any of the top three selections in Table 3) achieves
performances significantly higher than previously re-
ported models, with a reduced number of features.
Furthermore, the weighted SVM model yields better
results for each of the pathological classes with a class
accuracy always over 80%.
BIOSIGNALS 2010 - International Conference on Bio-inspired Systems and Signal Processing
18

Table 2: Distribution of heart beat classes in the two independent datasets.
N S V F Total
Training 45801 938 3708 414 50861
90.05% 1.84% 7.29% 0.81% 100%
Test 44202 1835 3204 388 49629
89.06% 3.7% 6.46% 0.78% 100%
Table 3: Selection of the most interesting results out of the 31 configurations with the weighted SVM model (sorted in
decreasing average accuracy). Best and worst results of the SVM model with no weights (“raw” SVM) are also displayed.
Results of previously reported comparable models are also included.
Model Feature sets Results
R-R Seg HBF HOS NSeg N S V F Avg.
Weighted SVM • • 75.1 89.3 86.9 80.7 83.0
(Top 5) • 77.8 63.8 86.9 94.6 80.8
• • • • 75.4 89.4 75.4 66.8 76.8
• • 83.8 78.7 73.0 35.1 67.6
• • 88.5 78.6 74.2 4.6 61.5
...
(Selected) • 63.2 61.5 80.2 16.8 55.4
• • • • • 79.5 28.8 73.8 3.6 46.4
• 78.0 25.9 78.7 0.3 45.7
• 78.1 2.1 60.8 6.2 36.8
...
(Bottom 3) • 47.8 13.5 57.4 15.2 33.5
• • • 75.2 3.7 52.6 0.8 33.1
• • 68.5 4.5 53.7 1.0 31.9
“Raw” SVM • • • • 96.2 7.4 80.5 33.0 54.3
(Best and worst) • 100.0 0 0 0 25.0
Hierar. SVM (Park et al., 2008) • • • 86.2 82.6 80.8 54.9 76.1
Weighted LDA (Chazal et al., 2004) • • 86.7 53.3 67.3 71.6 69.7
6 CONCLUSIONS
The classification of heart beats is of great impor-
tance for clinical applications involving the long-term
monitoring of the cardiac function. The main diffi-
culty is the extraction of discriminative features from
the heart beat time series. The goal of this work is
the assessment of the relevance of feature sets often
used in the literature. Five feature groups are consid-
ered: R-R intervals, segmentation features, HBF coef-
ficients, higher-order statistics and patient-normalized
segmentation features.
For this purpose, this work has followed and mo-
tivated the use of:
• AAMI guidelines for the establishment of reliable
classifiers and for the evaluation of their relative
merits;
• inter-patient rather than intra-patient classifica-
tion;
• weighted multi-class SVM models to address the
class unbalance problem;
• preprocessing and dataset preparation according
to the literature;
• and the average class accuracy as performance
measure.
Best results are obtained with the combination of
R-R intervals and segmentation features, with an aver-
age class accuracy of 83.0%. Any addition of features
to these two groups leads to a lower performance. In
particular, the normalization of the segmentation fea-
tures with respect to each patient provides a lower
accuracy when these features are coupled with R-R
intervals. When R-R intervals are not added in the
model, it has been impossible to obtain more than
55.4% (obtained by the segmentation features alone)
which is unacceptable. To the opposite, it is interest-
ing to observe that R-R intervals alone already lead to
80.8% of average accuracy.
These results show that R-R intervals are clearly
the most significant features to include in a heart beat
FEATURE RELEVANCE ASSESSMENT IN AUTOMATIC INTER-PATIENT HEART BEAT CLASSIFICATION
19

classification problem. The second most important
features are morphological features. The other feature
groups such as Hermite basis function expansion co-
efficients, higher-order autocorrelation statistics and
patient-normalized features do not seem to serve the
classification performances.
These results obtained with the weighted SVM
model and R-R intervals combined to segmentation
features are significantly better than previously re-
ported inter-patient classification models. In particu-
lar, the classification performances for the pathologi-
cal classes are always improved with more than 80%;
those classes are of crucial importance for the diag-
nosis. Furthermore, these performances are achieved
with a reduced number of features. The choice of the
features is thus a task of major importance, as a bad
selection or too many features can lead to unaceptable
results.
Another important issue for classification of heart
beats resides in the class unbalance, which is met with
weights being included in the SVM model. Indeed,
the average accuracy obtained by the model with our
best feature selection decreases from 83.0% to 54.3%,
with an accuracy of only 7.4% for class S and of
33.0% for class F when these weights are removed,
leading to rather useless models that are unable to
grasp the importance of the pathological cases.
ACKNOWLEDGEMENTS
G. de Lannoy is funded by a Belgian F.R.I.A. grant.
This work was partly supported by the Belgian
“R
´
egion Wallonne” ADVENS and DEEP projects.
REFERENCES
Association for the Advancement of Medical Instrumenta-
tion (1998). Testing and reporting performance results
of cardiac rhythm and st segment measurement algo-
rithms. ANSI/AAMI EC38:1998.
Chazal, P. D., O’Dwyer, M., and Reilly, R. B. (2004). Auto-
matic classification of heartbeats using ecg morphol-
ogy and heartbeat interval features. Biomedical Engi-
neering, IEEE Transactions on, 51:1196–1206.
Cheng, W. and Chan, K. (1998). Classification of electro-
cardiogram using hidden markov models. Engineer-
ing in Medicine and Biology Society, 1998. Proceed-
ings of the 20th Annual International Conference of
the IEEE, 1:143–146.
Christov, I., G
´
omez-Herrero, G., Krasteva, V., Jekova, I.,
Gotchev, A., and Egiazarian, K. (2006). Comparative
study of morphological and time-frequency ecg de-
scriptors for heartbeat classification. Med. Eng. Phys.,
28(9):876–887.
Clifford, G. D., Azuaje, F., and McSharry, P. (2006). Ad-
vanced Methods And Tools for ECG Data Analysis.
Artech House, Inc., Norwood, MA, USA.
Franc¸ois, D. (2008). Feature selection. In Wang, J., ed-
itor, Encyclopedia of data mining and warehousing,
second edition, Information Science Reference.
Goldberger, A., Amaral, L., Glass, L., Hausdorff, J., Ivanov,
P. C., Mark, R., Mietus, J., Moody, G., Peng, C.-K.,
and Stanley, H. (2000). PhysioBank, PhysioToolkit,
and PhysioNet: Components of a new research re-
source for complex physiologic signals. Circulation,
101(23):e215–e220.
Guyon, I., Gunn, S., Nikravesh, M., and Zadeh, L. A.
(2006). Feature Extraction: Foundations and Appli-
cations (Studies in Fuzziness and Soft Computing).
Springer-Verlag New York, Inc., Secaucus, NJ, USA.
Lagerholm, M., Peterson, C., Braccini, G., Edenbrandt,
L., and Sornmo, L. (2000). Clustering ecg com-
plexes using hermite functions and self-organizing
maps. Biomedical Engineering, IEEE Transactions
on, 47(7):838–848.
Melgani, F. and Bazi, Y. (2008). Classification of electro-
cardiogram signals with support vector machines and
particle swarm optimization. Information Technology
in Biomedicine, IEEE Transactions on, 12(5):667–
677.
Osowski, S. and Hoai, L. (2001). Ecg beat recognition us-
ing fuzzy hybrid neural network. Biomedical Engi-
neering, IEEE Transactions on, 48(11):1265–1271.
Osowski, S., Hoai, L., and Markiewicz, T. (2004). Sup-
port vector machine-based expert system for reliable
heartbeat recognition. Biomedical Engineering, IEEE
Transactions on, 51(4):582–589.
Park, K., Cho, B., Lee, D., Song, S., Lee, J., Chee, Y., Kim,
I., and Kim, S. (2008). Hierarchical support vector
machine based heartbeat classification using higher
order statistics and hermite basis function. In Com-
puters in Cardiology, 2008, pages 229–232.
Platt, J. C. (1999). Fast training of support vector machines
using sequential minimal optimization. In Scholkopf,
B., Burges, C., and Smola, A., editors, Advances in
Kernel Methods. The MIT Press.
Vapnik, V. N. (1999). The Nature of Statistical Learning
Theory (Information Science and Statistics). Springer.
Yinggang, Z. and Qinming, H. (2006). An unbalanced
dataset classification approach based on v-support
vector machine. In Intelligent Control and Automa-
tion, 2006. WCICA 2006. The Sixth World Congress
on, volume 2, pages 10496–10501.
BIOSIGNALS 2010 - International Conference on Bio-inspired Systems and Signal Processing
20
