
Information Systems Configuration Analysis using
Event-driven Computer Simulation
Tomasz Walkowiak and Katarzyna Michalska
Institute of Computer Engineering, Control and Robotics
Wroclaw University of Technology
Janiszewskiego 11-17, 50-372 Wroclaw, Poland
Abstract. The paper presents a method of analyzing dependability aspects of
service oriented information systems. The system analysis is based on functional-
dependability model suitable for system simulation. The model is described by
XML Domain Modelling Language (XDML). The model is automatically trans-
form into an input model for computer simulation. For event-driven simulation
modified SSFNet simulator is used. Based on simulation results some depend-
ability metrics are calculated: availability and response time of a business ser-
vice. The paper presents service oriented information system model, method of
its analysis with support of created tool that was tested on a exemplary system.
1 Introduction
Service oriented complex information system [3] infrastructure is nowadays the core of
a large number of companies. Everybody expects that product, service or information
will be available to each request no matter where they are. That is why service conti-
nuity is particularly important for each company since clients do not tolerate service
unavailability - in case of service problems, they go to another company. This cause
a strong trend to create complex information systems more safe, efficient and depend-
able. Still those systems have to be very flexible in case of economic factors. It is very
important to control company’s costs and maximal usage of technical infrastructure re-
sources. To do that there is a need of analyzing various system configuration and chose
the optimal solution taking both aspect (technical and economical one) into considera-
tion.
In this paper we propose a technique of using system simulation and modelling lan-
guage [2], to face business service continuity problem and specify configurations that
can be optimal for the company.
2 Modelling
Service oriented complex information system (SOCIS) aims to fulfill user needs in
case of its request. In this kind of systems, user request mainly perform by business
service level of the system [5]. In this case we can speak about specified queue for
Walkowiak T. and Michalska K. (2009).
Information Systems Configuration Analysis using Event-driven Computer Simulation.
In Proceedings of the 7th International Workshop on Modelling, Simulation, Verification and Validation of Enterprise Information Systems, pages
162-167
DOI: 10.5220/0002202601620167
Copyright
c
SciTePress

the task realization (choreography) since each task is done using one or more service
components that interact with each other. Service is being done on a technical ground
of the system - technical infrastructure. We can describe service oriented system as a:
task specify by the user, technical infrastructure of the system, service working on the
system, system user, time parameters of the system and task.
Since in the service oriented complex information system we have to focus on many
different and complicated aspect of the system to model it, we propose one common de-
scription language that is called XDML - XML Domain Modelling Language. Proposed
language is a representation the SOCIS model based on XML format. It consist of: sys-
tem topology,network configuration, static and dynamic part of the service description,
description of the users and their behaviours, hardware/software failures, the security
functionality aspects of each node (i.e. firewall rules).
The XDML is defined by XML schema. Moreover, an Integrated Analysis Envi-
ronment (IAE) tool was developed by authors to allow a graphical way of modelling
information system. A user is able to model any system topology, having a graphical
view of its hardware and software components. Each parameter of XDML model could
be is accessed by the IAE interface. XDML service model realize two kinds of task
(local and external). The main purpose of designing of XDML was to able to perform a
analysis of the modelled information system using simulation approach.
3 System Analysis
There are various method for system analysis with concern of different observation of
the system. One of this methods is computer simulation [2], [6] that performs system
behaviour using its model (represented as a input model). Simulation has also some
disadvantages e.g. labour intensity of mode creation, simulation results can be hard to
interpretation. Still this solution seams to be appropriate to analyze complex informa-
tion systems that are based on event driven behaviour. Simulation tool for this kind of
events are mostly computer network simulators.
Experiments reported in this paper were performed using the SSFNet simulation
environment [4]. SSFNet is a network simulator developed by the Renesys Corporation
with support from DARPA. We have selected SSFNet among other network simulators
since models of protocols and network elements are open-source. Therefore, it allows
modification of the code. Moreover, we use Java based version of SSFNet, because it
allows much faster development.
SSFNet simulator consists of three major parts: SSF engine, Domain Modelling
Language (DML) [4], and SSFNet models. The SSF (Scalable Simulation Framework)
is public-domain standard for discrete-event simulation. Scalable Simulation Frame-
work is a base for higher level - the SSFNet. SSFNet module is a collection of Java
packages for modelling and simulation of networks and Internet protocols. Moreover
SSFNet uses public-domain standard called DML to configure simulation scenarios.
An extension to the simulator was developed It includes support for traffic genera-
tion (models of user behaviour with randomness), simulation of business level services,
implementation of resource consumption and fault model. Errors were introduced in
different levels (link, network adapter and software component failures). It was as-
163

sumed that a failed element ceases to operate completely. The results of component
failing are observable at the service level. For example some requests/responses are
being delayed or lost. Adding new functionality required the extension of DML used
in standard SSFNet version. Moreover, SSFNet was extended to perform Monte-Carlo
approach. Results of simulation are recorded in XML based output file. It includes in-
formation (name of the service, time) of user requests and service responses. It is a base
for calculating dependability metrics.
4 Dependability Metrics
In [1] authors described basic set of dependability attributes. This is a base of defining
different dependability metrics used in dependability analysis of computer systems and
networks. In this paper we would like to focus on more functional metrics which could
be used by the operator of the information system.
For the needs of this research we provided two metrics of information system de-
pendability: business service availability and response time. Due to a randomness of
a user behaviour the calculation of these metrics was done based on Monte-Carlo ap-
proach by repeating simulation of the same system N times over analyzed period T .
Therefore, all defined below metrics are calculated as an average over all batches of
simulation.
Since availability in mostly understood as a probability that request send from user
to the systems are being served properly, therefore, the business service availability can
be computed on the basis of observed system events, taking into consideration N probes
of simulation with analyzed period T :
SA =
1
NT
N
X
i=1
t
i
up
(1)
whereas t
i
up
is a the time of business service being working in i-th simulation (since
we are looking on the system form the client perspective, therefore, we assume that
business service is working if and only if system responds to the client in a proper
way).
The second proposed metric is the business service response time. It is calculated
as an average delay between the starting time of user response (t
i request
) and getting
answer (t
i response
) from the business service (i.e. only requests that were properly
answered are taken into account).
SRP =
1
N requests
N requests
X
i=1
t
i response
− t
i request
(2)
This metric is not directly influenced by failures of any system hardware or software
component. In case of long failures of the service the calculated metric could become
random due to a low number of properly answered requests, for service being failed
over all simulated time the sub service response time is not defined. In case of SO-
CIS systems SRP value is strongly bonded with computational power, resources and
overload of the system technical infrastructure.
164
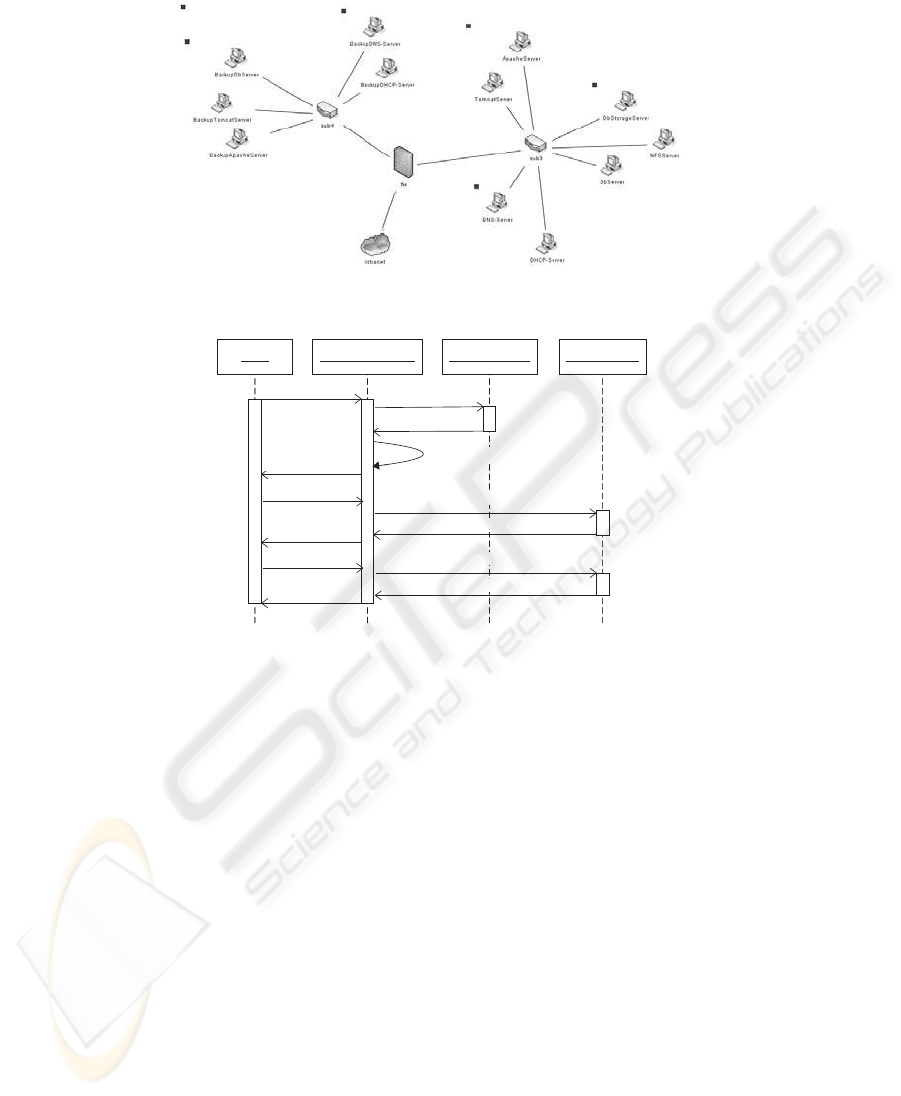
Fig.1. Testbed - system view.
Client ApacheComponent DNSComponent DBComponent
GetMainPage(req)
GetMainPage(resp)
GetDnsAddress(req)
GetDnsAddress(resp)
JobsList(req)
JobsList(resp)
NewsList(resp)
NewsList(req)
GetJobsData(req)
GetJobsData(resp)
GetNewsData(req)
GetNewsData(resp)
ShowMainPage
Fig.2. Testbed - scenario view.
5 Test Case System
For the case study analysis we propose an exemplar system illustrated in Fig. 1. The
system is composed of tree networks: one is a client network (marked as intranet), other
are service provider networks (one primary and second backup one). Essentially the
test-bed system implements tree main service components: ”GetMainPage”, ”JobsList”
and ”NewsList” that can interact with each other as shown on Fig. 2.
The described system was modelled in XDML using IAE tool (figures 1 and 2 are
screenshots from IAE application). Two configuration were analysed. The only differ-
ence between them is allocation of technical service realising ”DNSComponent” (see
scenario on Fig. 2).
In the first configuration (named ”config1”) the ”DNSComponent” is allocated on
”DNS-Server” (see Fig. 1) whereas in second (”config2”) the service component is
allocated on ”BackupDNSServer” which is assumed to be a much slower host then
”DNS-Server”. The achieved results, i.e. business service response time, for a different
number of concurrent clients are presented on Fig. 3. As it was expected the response
165
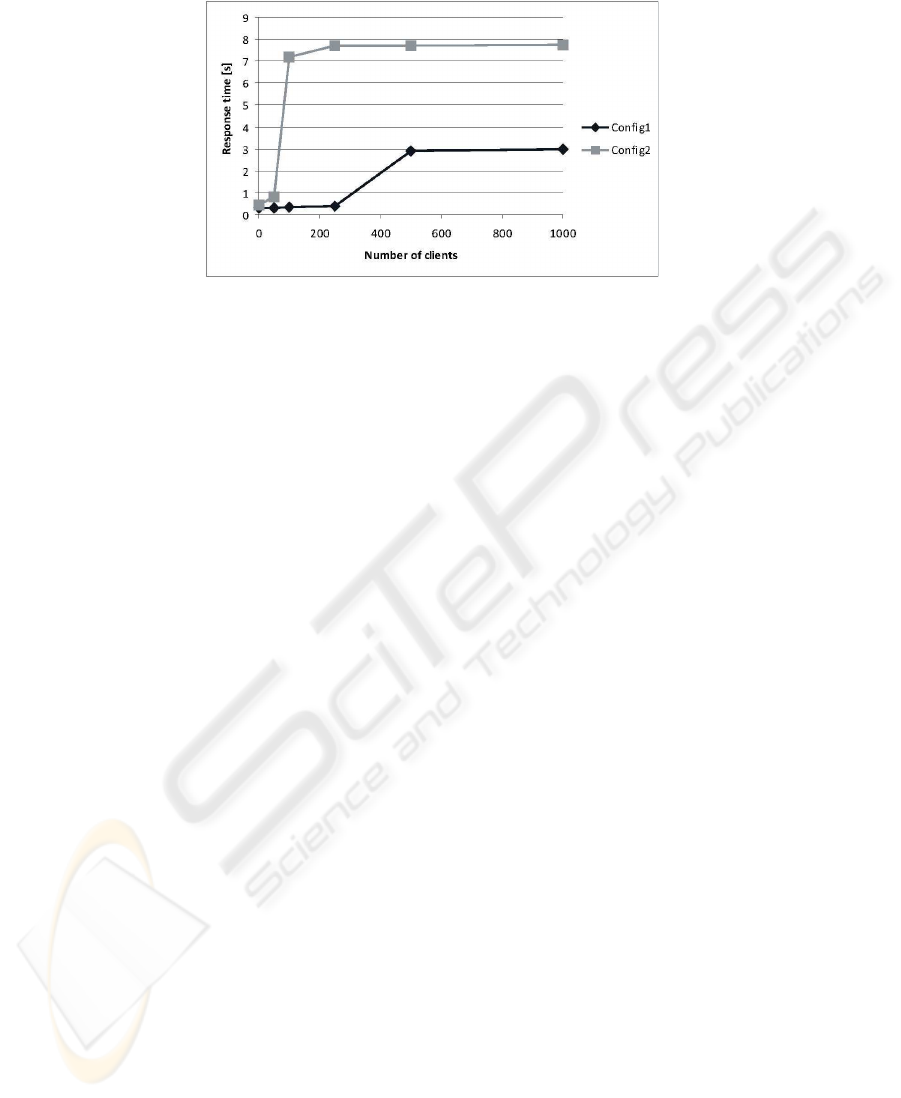
Fig.3. Business service response time in a function of number of clients for two different config-
urations.
time in a second configuration is longer than in the first one. For one client the difference
in response times of these two configurations is equal to a difference in an execution
of ”DNSComponnet” on the ”DNS-Server” and ”BackupDNSServer” host. It could be
estimated without any simulation tool. However, when the number of clients enlarges
the situation becomes harder for a human being to be analysed. Enlarging a number of
clients enlarges a number of concurrent executions of a given service component, what
causes the enlarge of service component execution time. The effect of enlarging the
execution time is not linear in a function of number of clients since longer execution
times cause a larger number of concurrent executions what enlarges execution times
again. This is a kind of a feedback effect. However it has a limitation. As it could be
noticed on Fig. 3 the execution time for a very large number of clients (500-1000) stops
to increase so fast as for a medium number of clients (50-500). The reason of this effect
is due to a limitations of number of concurrent executions on each host (maximum
number of threads in technical service) and a time-out effect (each execution of service
component has a time-out after each the execution of a given service component is
assumed to be failed). The effect is more understandable looking at on Fig. 4, which
presents the estimation of availability of the business service in a function of number of
clients for two analysed configurations. The mentioned before time-out and a maximum
number of thread effect results in dropping some requests and therefore decreases the
availability parameter.
6 Conclusions
We have presented a simulation approach to an analysis of service oriented complex in-
formation system. Developed software allowsto analyze different dependability metrics
of the system in a function of model parameters, like for example a number of clients or
different configurations (allocations of service component on different hosts). The pre-
sented results - business service availability and response time in a function of a number
of clients for two different configuration show the possibilities of presented approach
and developed software (Integrated Analysis Environment with extended SSFNet simu-
166
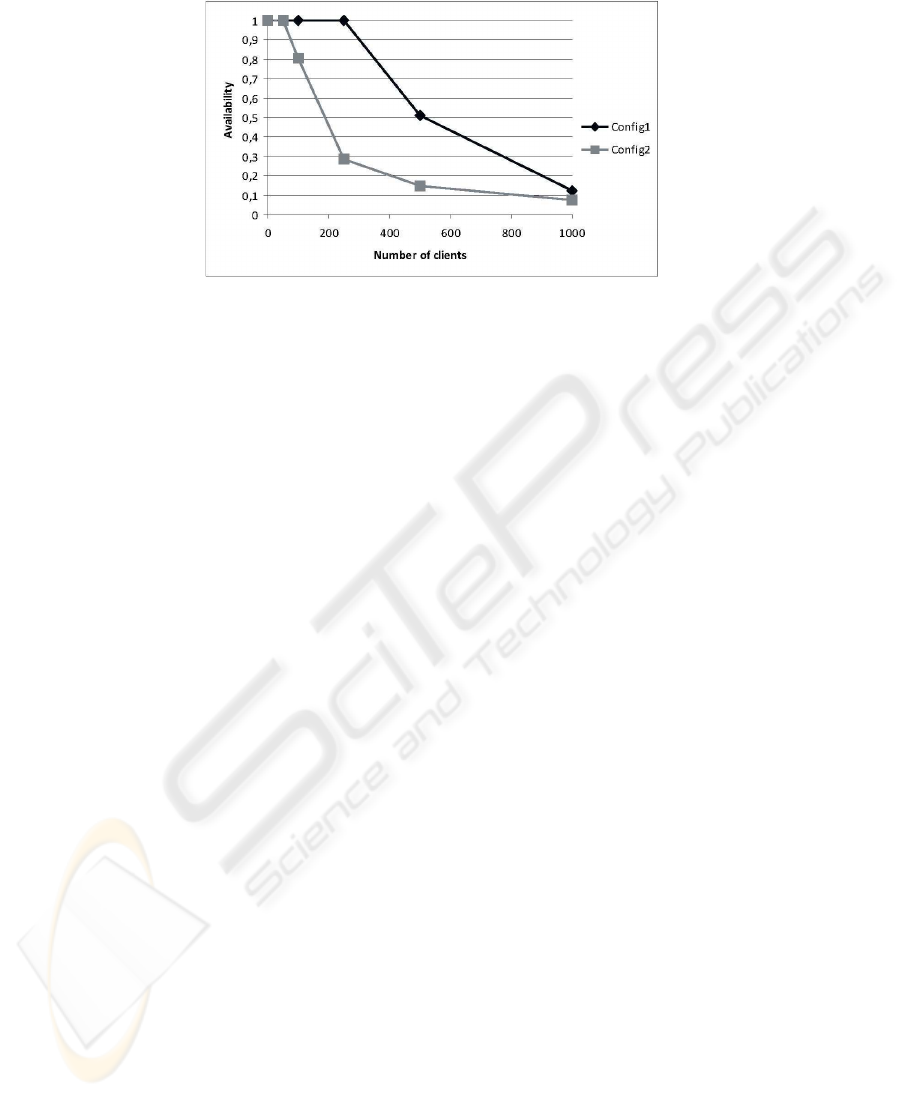
Fig.4. Business service availability in a function of number of clients for two different configu-
rations.
lator). The tool could be used for example for a selection of the best (according to some
metric) configuration among a large set of them. Moreover, a proposed approach helps
a human being to understand the complex information system behaviour. A usage of
graphical interface (IAE) integrating whole modelling and analysis process makes the
tool useful, therefore, the presented approach allows to improve a process of designing
and administration of service oriented information system.
References
1. Aviienis, A., Laprie, J., Randell, B.: Fundamental Concepts of Dependability. 3rd Information
Survivability Workshop (ISW-2000), Boston, Massachusetts, USA (2000)
2. Birta L., Arbez G.: Modelling and Simulation: Exploring Dynamic System Behaviour.
Springer London (2007)
3. Gold N., Knight C. , Mohan A., Munro M.: Understanding service-oriented software, IEEE
Software, vol. 21 (2004) 71– 77.
4. Nicol, D., Liu, J., Liljenstam, M., Guanhua Y.: Simulation of large scale networks using SSF.
Proceedings of the 2003 Winter Simulation Conference, Volume 1, 7-10 December 2003,
(2003) 650–657.
5. Michalska K., Walkowiak T.: Hierarchical approach to dependability analysis of information
systems by modeling and simulation. The Second International Conference on Emerging Se-
curity Information, Systems and Technologies (SECURWARE 2008), Cap Esterel, France,
25-31 August 2008, IEEE Computer Society [Press], (2008) 356–361.
6. Sheikh A., Ajeeli A., Abu-taieh E.: Simulation and Modeling: Current Technologies and Ap-
plications. IGI Global (2007)
167
