
CLASSIFICATION OF MOTOR IMAGINARY TASKS USING
ADAPTIVE RECURSIVE BANDPASS FILTER
Effective Classification for Motor Imaginary BCI
Vickneswaran Jeyabalan, Andrews Samraj
Faculty of Engineering and Technology,Faculty of Information Science and Technology, Multimedia University
Jalan Ayer Keroh Lama, Melaka, Malaysia
Loo Chu Kiong
Faculty of Engineering and Technology, Multimedia University, Jalan Ayer Keroh Lama, Melaka, Malaysia
Keywords: Brain Computer Interface, Motor imagination, mu rhythm, adaptive filtering.
Abstract: The noteworthy point in the advancement of Brain Computer Interface (BCI) research is not only to develop
a new technology but also to adopt the easiest procedures since the expected beneficiaries are of disabled.
The nature of the locked-in patients is that, they possess strong mental ability in thinking and understanding
but they are extremely unable to express their views. Imagination is possible for almost all of the locked-in
patients; hence a BCI which does not rely on finger movements or other muscle activity is definitely an
added advantage in this arena. The objective of this paper is to identify and classify motor imaginary signals
extracted from the left and right cortex of the human brain. This is realised by implementing an adaptive
bandpass filter with the combination of frequency shifting and segmentation techniques. The signals are
captured using Electro-Encephalogram (EEG) from the C3, C4, and Cz channels of the scalp electrodes and
is pre-processed to expose the motor imaginary signals. The result of classification using a simple threshold
articulates the effectiveness of our proposed technique. The best results were found in the latency range of 3
to 9 seconds of the imagination and this proves the existing neuro-science knowledge.
1 INTRODUCTION
Brain Computer Interface (BCI) or also know, as
Brain Machine Interface (BMI) is a communication
interface between the brain and machine. The main
purpose of a BCI is to provide a new mode of
communication for people who have severe motor
disabilities but being cognitively intact. (Baharan et
al., 2005). The input, which is the brain signal, for a
BCI system can be obtained invasively or non-
invasively. The method of obtaining brain signals by
electrode implantation is knows as an invasive
approach. This method is frequently described as
dangerous because it involves surgical procedures to
implant the electrodes in the brain. Whereas, brain
signals taken from the electrodes placed on the
surface of the scalp is categorised as a non-invasive
method. This method can be performed by using the
Electro-Encephalogram (EEG). Various types of
signals are used as an input for the EEG based BCI.
For example, Visual Evoked Potential (Andrews et
al., 2005; Andrews et al., 2007), Mu-rhythm
(Coyle et al, 2005) and P300 (Donchin et al, 2000).
In this paper we concentrate on the motor
imagination signals which co-relates with the mu-
rhythm.
The human brain’s sensory motor cortex shows
the rhythmic activities of physical motor
movements. This can also be observed during motor
imagination. (Pfurtscheller and Neuper, 2003). This
rhythmic activity can be observed in the Alpha
frequency band of an EEG signal, which is in the
frequency range of 8Hz to 12Hz. Mu rhythm can be
best measured from the EEG channel C3, Cz and
C4.
Imagination of motor movements results in the
power attenuation of the EEG signal and can be
observed as features. The attenuation of the power is
known as event related de-synchronisation (ERD)
whereas the rebounding of the power is known as
113
Jeyabalan V., Samraj A. and Chu Kiong L. (2008).
CLASSIFICATION OF MOTOR IMAGINARY TASKS USING ADAPTIVE RECURSIVE BANDPASS FILTER - Effective Classification for Motor Imaginary
BCI.
In Proceedings of the International Conference on Signal Processing and Multimedia Applications, pages 113-118
DOI: 10.5220/0001935501130118
Copyright
c
SciTePress
event related synchronisation (ERS). The ERD or
ERS occurs contra laterally to the intended
movements. For example, for right motor
movements, the ERD is observed at the left
hemisphere of the brain and for the left motor
movements, the ERD is found at the right
hemisphere. Classifications of right or left motor
movements are usually made based on the ERD of
the signal.
In a normal ERD detection procedure (Kalcher
and Pfurtscheller, 1995), EEG signals are usually
filtered in a narrow band, squared, low pass filtered
and averaged over trial. However, it is
disadvantageous to use this method because useful
information will be lost from the averaging over
multi-trials.
In this paper we have implemented the adaptive
recursive bandpass filter (Gharieb and Cichocki,
2001) to detect imaginary motor movements and to
classify them according to left or right movements
without observing the ERD and averaging over multi
trials. Implementation of this method reduces the
chances of information lost and increases the
classification rate. This method has been
successfully implemented on the BCI Competition
2003 dataset IIIb, which consists of 140 labelled and
unlabelled trials respectively, further information of
the data set, is explained in the next section.
The target signal, which contains mu rhythm, is
first pre-processed by implementing a band pass
filter. Then, the adaptive recursive bandpass filter is
used to estimate the dominant signal, which
represents the motor movements. The employed
adaptive recursive filter is used to trail the centre
frequency of the dominant EEG signal. The filter
requires only one coefficient to be updated in order
to adjust the centre frequency of the filter bandpass
to be approximated with that of the input signal
(Gharieb and Cichocki, 2001). The time function of
the coefficient represents the distinct feature for each
signal and represents either left or right imaginary
motor movements.
2 METHODOLOGY
2.1 Data Set
This method was trialed on the BCI Competition
2003, dataset IIIb (BCI Competition II, 2003). The data
set was provided by the Department of Medical
Informatics, Institute for Biomedical Engineering,
University of Graz. The signals were obtained from
a 25-year-old female relaxing on a chair with
armrest. The task was to control a feedback bar by
means of imagining left hand of right hand
movements. The data was acquired from the EEG
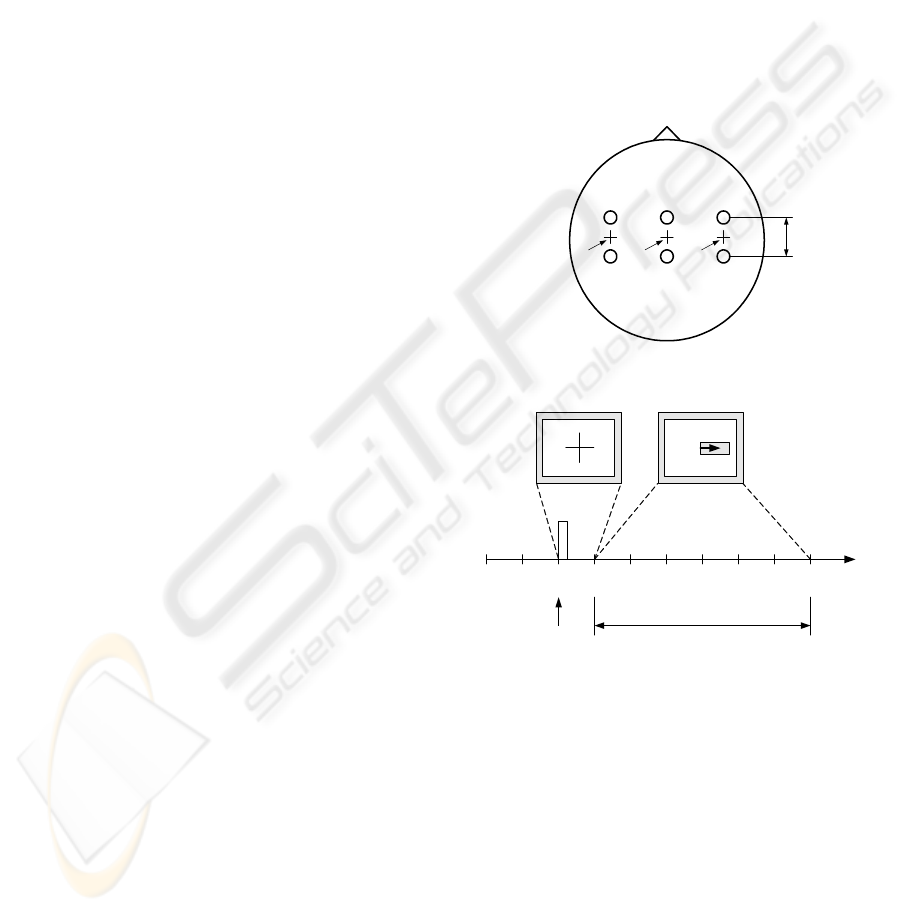
channels C3, Cz, and C4 (figure 1), which was band
pass filtered for a frequency range of 0.5 to 30Hz
and sampled at 128 Hz. The experiment consists of 7
runs with 40 trials each. All runs were conducted on
the same day with several minutes break in between.
The data has a total of 280 trials, which consists of
140 labelled and 140 unlabeled trials with an equal
number of left hand and right hand movements.
Each trial consists of duration of 9 seconds. At the
3
rd
second a visual cue, an arrow pointing left or
right is presented to indicate left or right motor
movements is to be imagined.
32
321C3 Cz C4
1
5 cm
Figure 1: Electrode positions.
0123456789
sec
Trigger
Beep
Feedback period with Cue
Figure 2: The timing scheme.
2.2 Signal Analysis
The trials were divided into two groups according to
right or left motor imaginary. Signals from channel
C3 and C4 of each group are first pre-processed by
means of band pass filtering. A band pass filter
using 7
th
order Butterworth filter where the pass
band is 9Hz with less than 1 dB of ripple and the
stop band is 11Hz with at least 6 dB of attenuation.
Signals from channel Cz is ignored because it
contains very little significant discriminative
features (Lemm et al., 2004). After band passing the
signals, we could observe that the signal is densely
SIGMAP 2008 - International Conference on Signal Processing and Multimedia Applications
114
populated by the main receptive frequencies, which
are the range of 8 Hz to 10Hz at the 3
rd
to 9
th
seconds. This is because the motor imaginary task
begins after the que at the 3
rd
second.
Then the adaptive recursive bandpass filtering
(Gharieb and Cichocki, 2001) approach is applied to
the signals between the ranges of 3
rd
to 9
th
seconds
of each channel. This approach is employed to
estimate and track the centre frequency of the
dominant signal of each channel. The main
advantage of this approach is that the adaptive filter
updates only one coefficient (Gharieb and Cichocki,
2001). The coefficient is updated in order to adjust
the centre frequency of the filter band pass to be
matched with the input data (Gharieb and Cichocki,
2001). The time function of the coefficient
represents the features for each signal, which is
feasible to be used for classification. A fourth order
Butterworth band pass filter is employed as the
adaptive filter. The filter function, T (z) could be
expressed as (Raja Kumar et al., 1985; Raja Kumar
et al., 1990).
T(z)=
24
02 4
12 2 3 4
1 () ( () ') ()
12234
DDZ DZ
FC n Z F C n F Z FC n Z F Z
−−
++
−−−−
++++ +
where
2
1/( 2 1),
04
DD l l== ++
2,
20
DD=−
4,
13 0
DD D==− 2(2 2) ,
10
F
ll D=− +
2
4,
20
F
lD=
2
'2( 1),
20
F
lD=−
2( 2 2) ,
30
F
ll D=−+
2
(21),
40
F
llD=−+
cot ( )lanBP
π
=
(1)
The coefficient C (n) could be expressed as
cos( ( ( ) ( ))
21
()
cos( )
Hn Hn
Cn
BP
π
π
+
=
where
()
1
Hn= normalised low cut off frequency,
()
2
Hn= normalised high cut off frequency,
B
P = normalised bandwidth of the filter
(2)
B
P is assumed to be a constant value. Based on
equation 1 and 2, it can be seen that
()Cn
is the only
coefficient that has to be updated by the adaptive
filter since it is also the only coefficient which is
dependant with the centre frequency,
(
()
1
Hn+ ()
2
Hn)/2. Hence the filter has only one
centre frequency dependent,
()Cn to be updated. In
order for the filter, T (z) to be self-adjusted to the
centre frequency of the input signal, the output
power of the filter should be maximised (Raja
Kumar et al., 1985; Raja Kumar et al., 1990). The
adaptive coefficient is updated for the maximization
of the expected output power (Gharieb and
Cichocki, 2001). This step can be applied by
implementing a standard gradient approach (Gharieb
and Cichocki, 2001). An algorithm called recursive
maximum mean-squared (RMXMS) is used to
update the filter coefficient (Gharieb and Cichocki,
2001). The adaptive filter further enhances the
feature and provides good on-line information of the
feature’s distinct behaviour.
The adaptive filter becomes unstable for some
low frequency waves. This is because the adaptive
filter is a band pass filter and the EEG signal is a
low pass signal (Gharieb and Cichocki, 2001). So, in
order to solve this problem a high frequency shifting
process is employed to shift the EEG frequency to
the highest ones before the adaptive filtering
(Gharieb and Cichocki, 2001). The updated co
efficient is the used as the features that represents
the signals resulting from right or left motor
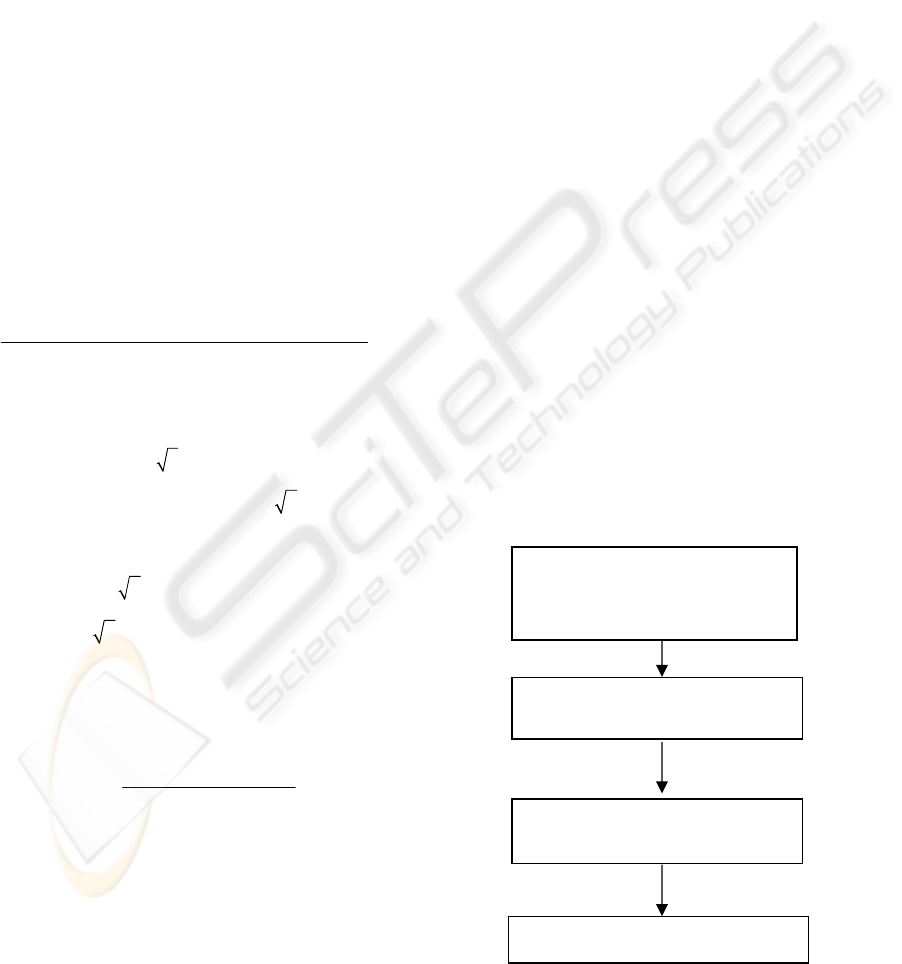
imaginary. Figure 3 shows the method applied
graphically. Figure 4 shows the extracted features
after implementing the proposed method for an
average of ten trials.
Figure 3: Signal analysis methodology.
Band pass 7
th
order Butterworth
filter
Input
EEG signals from channel.
C3 and C4
Adaptive Band pass filter. (4
th
order Butterworth filter)
Distance Based Classification
Filter co-efficient, C(n)
Pre Processed signal
CLASSIFICATION OF MOTOR IMAGINARY TASKS USING ADAPTIVE RECURSIVE BANDPASS FILTER -
Effective Classification for Motor Imaginary BCI
115
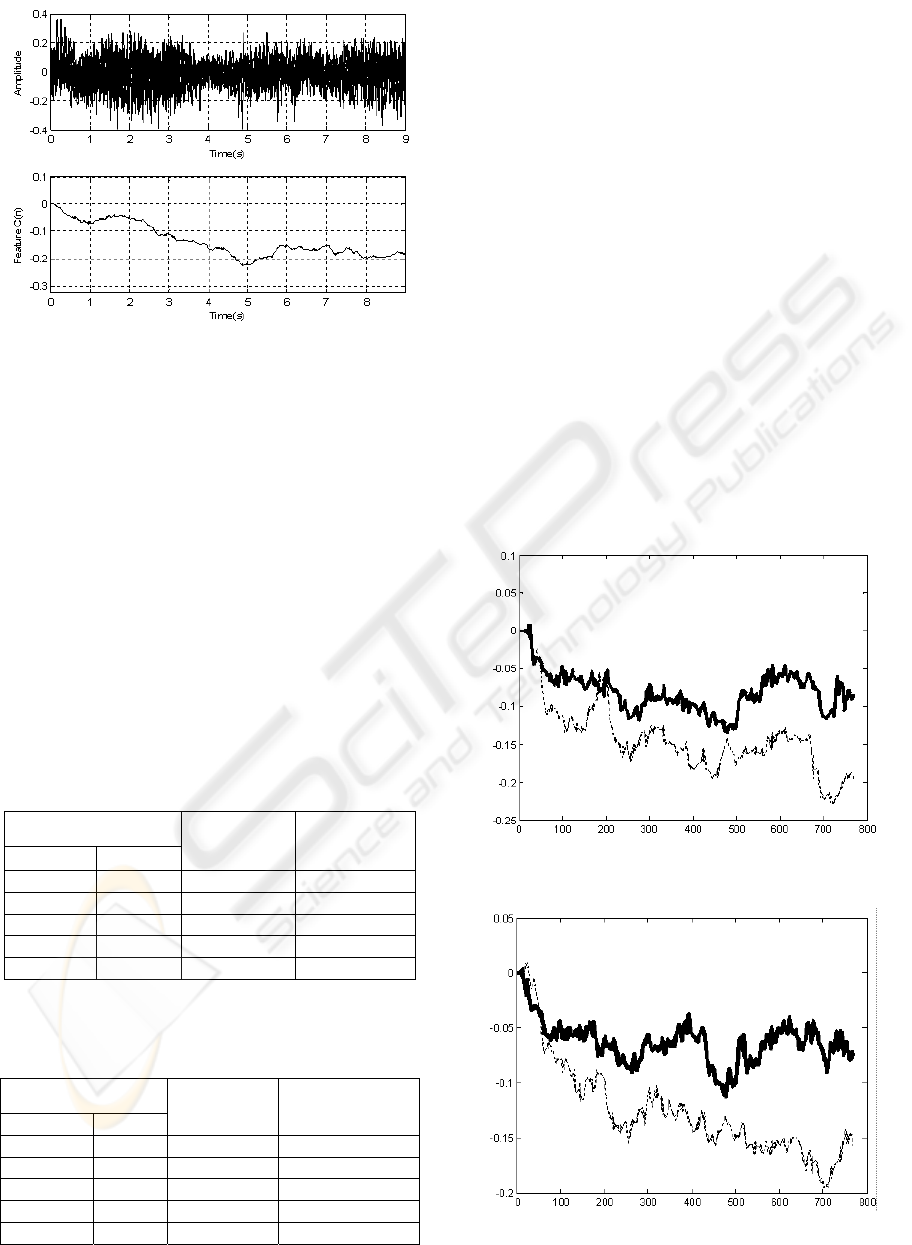
Figure 4: 10 Realisation of raw motor imaginary signals
(Top). Mean values of the extracted features after
performing adaptive recursive band pass filtering
(bottom).
As for the classification, features from both C3 and
C4 in a trial are taken. The sum values of the
features during right and left imaginaries for each
channel are taken respectively. The sum values
represent the feature sequences. The distance of the
features from C3, which is less than the features
from C4, is regarded as right hand movements.
Whereas, the distance of features from C3, which is
more than the features from C4, is regarded as left-
hand movements. Clear distinction between left and
right motor imaginary could be observed in the
features taken from the beginning of the imagination
period.
Table 1: Classification of motor imaginary respective to
the imagination period using ERD detection.
Time
Right hand
imaginary
Left hand
imaginary
Start (s) End (s)
3 9 73% 71%
3 6 76% 61%
3 5 63% 51%
3 4 56% 47%
1 3 44% 53%
Table 2: Classification of motor imaginary respective to
the imagination period using adaptive recursive b/pass
filter.
Time
Right hand
imaginary
Left hand
imaginary
Start (s) End(s)
3 9 100% 100%
3 6 100% 98%
3 5 91% 94%
3 4 61% 90%
1 3 70% 17%
3 RESULTS AND DISCUSSIONS
Experiments were conducted using the ERD
detection method (Kalcher and Pfurtscheller, 1995)
and also the adaptive recursive band pass filter. The
classification results for both of the methods are
shown in Table 1 and Table 2. It can be clearly
observed that the classification results using the
adaptive recursive band pass filter method
outperforms the conventional ERD detection
method. The classification accuracy varies according
to the time of when the features are taken. Referring
to Table 2, the best classification accuracy could be
seen from the time range of 3
rd
to 9
th
seconds.
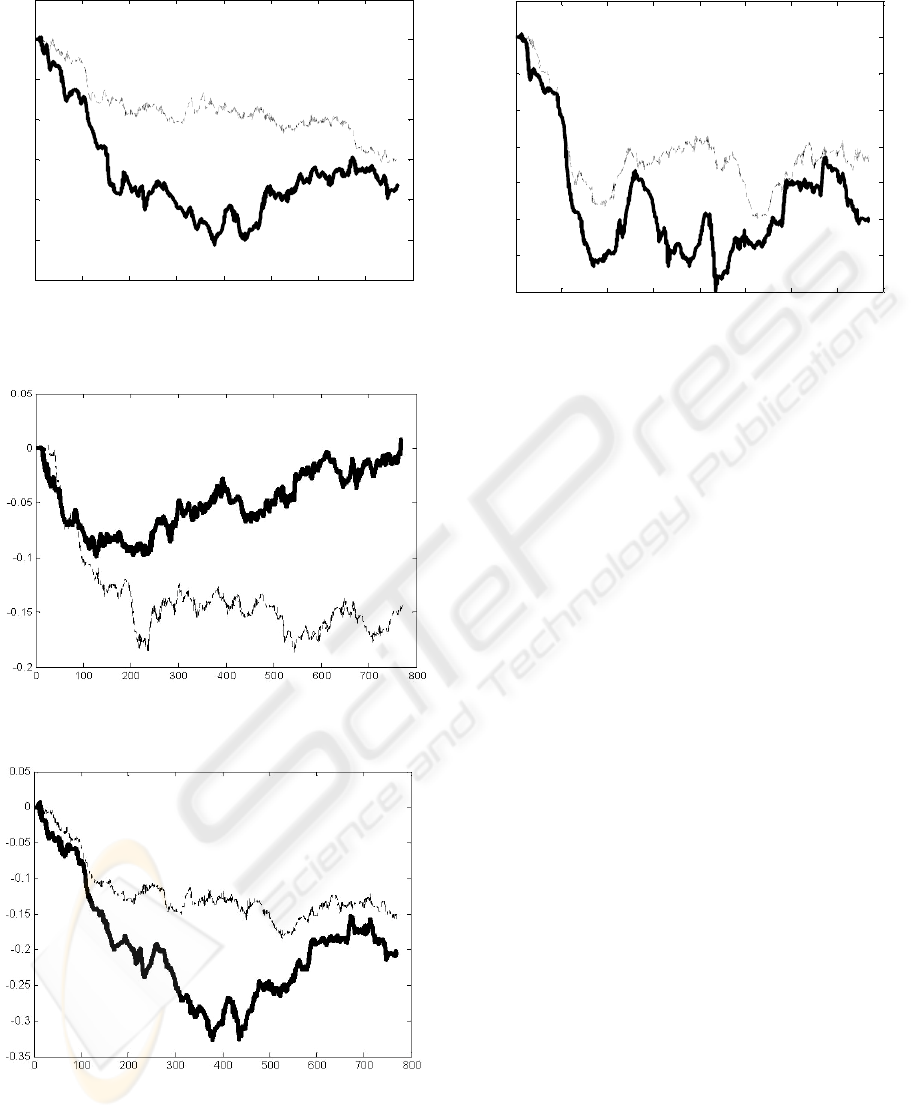
The results are also depicted in figures 5-10. Out
of the 140 labelled trials, 70 are with right hand
movement imaginaries and 70 are with left hand
movement imaginaries. Four sets of figures are
shown for each movement imaginaries where the
features are averaged over 15, 30 and 70 trials. It can
be seen that there are clear visual distinctions of the
features from channels C3 and C4 resulted contra
laterally from the hand movements.
Figure 5: Average 15 right hand trials. Dark line shows C4
features. Dotted line shows C3 features.
Figure 6: Average 30 right hand trials. Dark line shows C4
features. Dotted line shows C3 features.
SIGMAP 2008 - International Conference on Signal Processing and Multimedia Applications
116
0 100 200 300 400 500 600 700 800
-0.3
-0.25
-0.2
-0.15
-0.1
-0.05
0
0.05
Figure 7: Average70 right hand trials. Dark line shows C4
features. Dotted line shows C3 features.
Figure 8: Average 15 left hand trials. Dark line shows C4
features. Dotted line shows C3 features.
Figure 9: Average 30 left hand trials. Dark line shows C4
features. Dotted line shows C3 features.
0 100 200 300 400 500 600 700 800
-0.35
-0.3
-0.25
-0.2
-0.15
-0.1
-0.05
0
0.05
Figure 10: Average 70 left hand trials. Dark line shows C4
features. Dotted line shows C3 features.
4 CONCLUSIONS
From these results we could see that the features
from the motor imaginary signals extracted using
band pass filtering and adaptive filtering could be
discriminated easily. This method enables us to
obtain better classification results in comparison
with the conventional ERD detection methods.
Better classification results are obtained because;
this method eliminates the averaging over multiple
trials step, which causes useful features to be loss.
This technique could be also used to isolate other
rhythmic component in a signal. Although the
conventional way of bandpass filtering of a signal is
still feasible, this technique can be extended in
identifying useful sources and components in a
single trial recorded EEG signal.
ACKNOWLEDGEMENTS
We would like to acknowledge Department of
Medical Informatics, Institute for Biomedical
Engineering, University of Graz for making the data
available.
REFERENCES
Baharan Kamousi, Zhongming Liu, and Bin He, 2005,
Classification of Motor Imaginary Tasks for Brain-
Computer Interface Applications by Means of Two
Equivalent Dipoles Analysis, IEEE Trans.Neural
Sys.and Rehab. Engineering,Vol 13.
CLASSIFICATION OF MOTOR IMAGINARY TASKS USING ADAPTIVE RECURSIVE BANDPASS FILTER -
Effective Classification for Motor Imaginary BCI
117

BCI Competition II, 2003 http://ida.first.fraunhofer.de/
projects/bci/competition_ii
D.Coyle, G.Prasad, and T.M.McGinnity, 2005, A Time-
Frequency Approach to Feature Extraction for Brain-
Computer Interface with a Comparative Analysis of
Performance Measures, EURASIP Journal on Applied
Signal Processing,Hindawi publishing corp.
E.Donchin,K.M.Spencer, and R.Wijesinghe,Themental
prosthesis:Assesing the speed of a P300-based brain
computer interface,IEEE Trans.Rehab.Eng.,Vol
8,pp.174-179.
G. Pfurtsheller and C. Neuper, 2003, Movement and
ERD/ERS, Kluwer Academic/Plenum Publishers,
Dordrecht, pp. 191-207.
J. Kalcher and G. Pfurtscheller, 1995, “Discrimination
between phase-locked and nonphase-locked event-
related EEG activity,” Electroenceph. Clin.
Neurophysiol, vol. 94, pp. 381–4.
Lemm, S.; Schafer, C. and Curio, G., 2004,BCI
competition 2003-data set III: probabilistic modeling
of sensorimotor mu- rhythms for classification of
imaginary hand movements,Biomedical Engineering,
IEEE Transactions Vol 51, pp.1077 – 1080.
R. R. Gharieb and A. Cichocki, 2001, Segmentation and
tracking of the electro-encephalogram signal using an
adaptive recursive bandpass filter, Medical &
Biological Engineering & Computing 2001, Vol. 39,
pp. 237-248.
R. R. Gharieb and A. Cichocki, 2001, On-line EEG
classification and sleep spindles detection using an
adaptive recursive bandpass filter, Acoustics, Speech,
and Signal Processing, Proceedings. (ICASSP’01)
IEEE International Conference Vol 2.
R.V. Raja Kumar and R.N. Pal, 1985,A gradient algorithm
for center-frequency adaptive recursive band pass
filters, Proc. IEEE Vol 73,pp.371-372.
R.V. Raja Kumar and R.N. Pal, 1990, Tracking of
bandpass signals using center-frequency adaptive
filters, IEEE Trans. Acoust. Speech signal processing.,
vol 38, pp.1710-1721.
S.Andrews, R.Palaniappan, and N.Kamel, 2005,
Extracting Single Trial Visual Evoked Potentials using
Selective Eigen-Rate Principal Components, Proceed.
of World Academy of Science, Engineeering. and
Tech., Vol 7.
S.Andrews, T.Andrew and C.H.Loo, 2007, Inquisitive
Impact of Different Electrode Configuration in
Representing Single Trial P300 Visual Event Related
Potentials,,College Science in India.,Vol 2007.
SIGMAP 2008 - International Conference on Signal Processing and Multimedia Applications
118
