
The Linear Conditional Probability Matrix Generator
for IT Governance Performance Prediction
Mårten Simonsson, Robert Lagerström and Pontus Johnson
Department of Industrial Information and Control Systems
Osquldas väg 12, KTH, Royal Institute of Technology, 100 44 Stockholm, Sweden
Abstract. The goal of IT governance is not only to achieve internal efficiency
in an IT organization, but also to support IT’s role as a business enabler. The
latter is here denoted IT governance performance, and cannot be controlled by
IT management directly. Their realm of control includes IT governance matur-
ity, indicated by e.g. different IT activities, documents, metrics and roles. Cur-
rent IT governance frameworks are suitable for describing IT governance, but
lack the ability to predict how changes to the IT governance maturity indicators
affect the IT governance performance. This paper presents a Bayesian network
for IT governance performance prediction, learned with experience from 35
case studies. The network learns using the proposed Linear Conditional Prob-
ability Matrix Generator. The resulting Bayesian network for IT governance
performance prediction can be used to support IT governance decision-making.
1 Introduction to IT Governance
The concept of IT governance emerged in the nineties. Hendersen & Venkatraman [6]
and Loh & Venkatraman [15] then used the term to describe the array of interfirm
relationships involved in achieving strategic alignment of business and IT. Effective
IT governance provides mechanisms that enable IS/IT management to develop inte-
grated business and IT plans, allocate responsibilities, and prioritize IT initiatives
[12], [23], [29]. It is important to ensure that the IT governance is not only designed
to achieve internal efficiency in the IT organization, such as deploying good IT proc-
esses and making sure that the means and goals are documented. The final goal of
good IT governance is to provide the business with the best support needed in order
to conduct business in a good manner. The IT governance mechanisms should be
chosen so that the impact on the business is maximized. There are many activities in
the IT organization that can be changed, but clearly, not all changes affect the busi-
ness in a positive way. From an IT manager’s point of view, it would be of great
interest to know what impact each change made to the IT organization would have on
the business, in order to choose the most beneficial way to govern IT.
There already exist several frameworks aiming to support IT governance. Weill &
Ross have developed an IT governance framework based on just a few questions that
can be used to assign responsibilities for high level IT decision making, but their
work gives no further guidance on how the IT organization should actually transform
theory into practice [30]. The ISO/IEC 20000 and its predecessor IT Infrastructure
Simonsson M., Lagerström R. and Johnson P. (2008).
The Linear Conditional Probability Matrix Generator for IT Governance Performance Prediction.
In Proceedings of the 6th International Workshop on Modelling, Simulation, Verification and Validation of Enterprise Information Systems, pages
170-179
DOI: 10.5220/0001736301700179
Copyright
c
SciTePress
Library (ITIL) might aid the creation of processes related to delivery and support
[8],[19], [20]. ITIL also details establishment and maintenance of service level
agreements (SLA). ITIL has traditionally provided little support for strategic IT con-
cerns. However, this has been improved in recent ITIL v3 publications. Currently, the
Control Objectives for Information and related Technology (COBIT) is most well-
known framework for IT governance improvement, risk mitigation, IT value delivery
and strategic alignment maturity assessments [2], [5], [7], [22], [28]. The COBIT
framework was first issued by the IT Governance Institute, ITGI, in 1998 [9]. It de-
scribes the IT organization by means of 34 processes, within four domains: Plan &
Organize, Acquire & Implement, Deliver & Support, and Monitor & Evaluate. A
recent addition to COBIT is the Val IT framework, taking IT governance onto a
higher level of abstraction by providing general directions on how to manage IT from
a business point of view [10].
In this paper, the term IT governance performance is used to describe the good-
ness of an enterprise’s IT organization from a business point of view. The frame-
works presented in the paragraph above are mainly of descriptive nature, i.e. they
describe the state of an IT organization according to best practice on IT governance
or IT management. None of them has however the ability to foresee how the IT gov-
ernance performance is linked to the maturity of the IT organization in terms of its
activities, level of documentation, etc. The purpose of this paper is to propose a
method for prediction of IT governance performance within an enterprise. In particu-
lar, by using such method, it is possible to compare the current state with future sce-
narios. For instance, if the decision-making authority for acquisition of commodity
software is moved from business unit level to IT operations level, how would that
affect the IT governance performance? Making such predictions also enables pre-
scription, i.e. not only evaluating different scenarios, but also to chose rationally
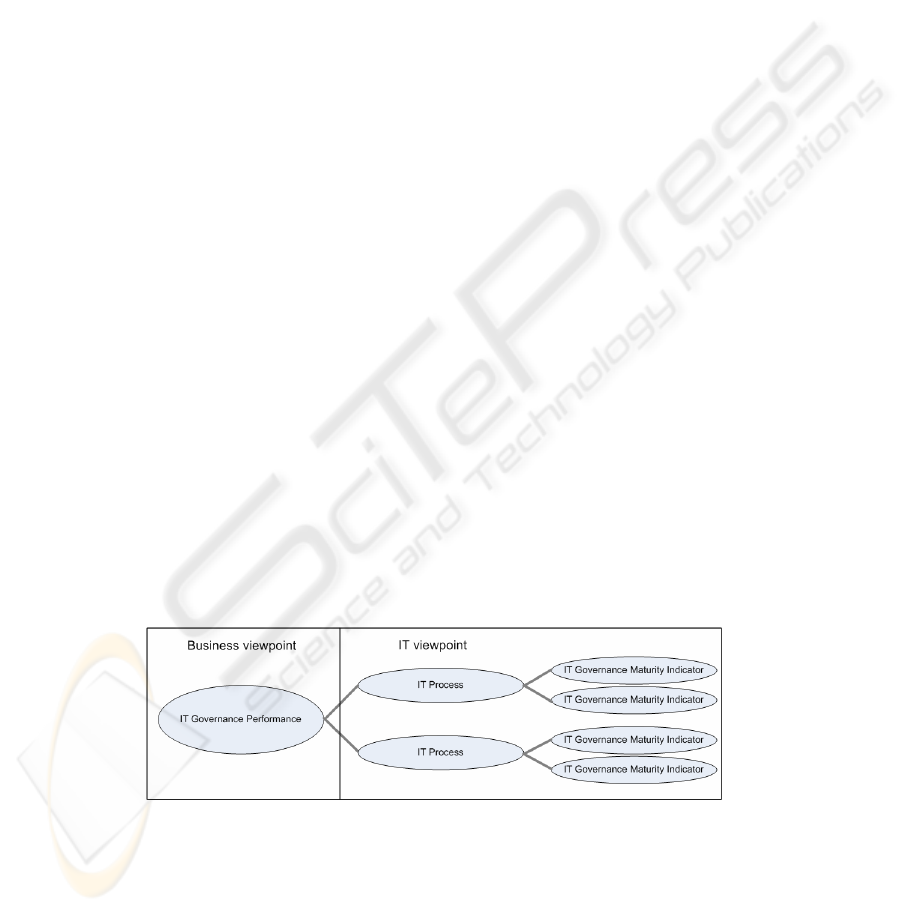
between them. Fig. 1 shows a conceptual view of the model for IT governance per-
formance prediction proposed in this paper. On the left side, there is the actual, intrin-
sic, IT governance performance, as seen from the business point of view. Clearly, the
aim of any organization would be to improve the IT governance performance to in-
crease stakeholder satisfaction and make sure that business runs as smoothly as possi-
ble. The IT governance performance is not directly controllable by IT management, but
IT processes for e.g. hardware acquisition, IT project management and IT strategy are in
the realm of control.
Fig. 1. The conceptual model for IT governance performance prediction. The IT governance
performance, as seen from the business viewpoint, is not directly controllable. Within the
realms of control for IT management are IT processes and IT governance maturity indicators.
171

Such IT processes are difficult to measure directly, but they comprise numerous
and measurable IT governance maturity indicators, including maturity of individual
IT related activities, level of monitoring, level of documentation, level of role as-
signment, etc. It is reasonable to believe that some of the IT governance maturity
indicators are correlated with the intrinsic IT governance performance, even though it
might be hard to establish the strength of the correlation. A model for prediction of IT
governance performance would need to take into account and define the impact of
each one of the IT governance performance indicators.
Several prediction methods are used in the research community today, including
Dempster-Shafer, Bayesian networks, neural networks, and multivariate analysis. Of
the above presented methods, Bayesian networks fulfill most requirements as pre-
sented in [12]. Therefore, such networks are used for IT governance maturity predic-
tion in this paper.
2 Bayesian Networks
Friedman describes a Bayesian network, B=(G, P), as a representation of a joint prob-
ability distribution, where G=(V, E) is a directed acyclic graph consisting of vertices,
V, and edges, E [3],[4]. The vertices denote a domain of random variables X
1
,…, X
n
,
also denoted chance nodes. Each chance node, X
i
, may take on a value x
i
from the
finite domain Val(X
i
). The edges denote causal dependencies between the nodes, i.e.
how the nodes relate to each other. The second component, P, of the network B, de-
scribes a conditional probability distribution for each chance node, P(X
i
), given its
parents Pa(X
i
) in G. It is possible to write the joint probability distribution of the
domain X
1
,…, X
n
using the chain rule of probability, in the product form
() ()()
∏
=
=
n
i
iin
XPaXPXXP
1
1
|,...,
.
In order to specify the joint distribution, the respective conditional probabilities that
appear in the product form must be found. The second component P describes distri-
butions P(x
i
| pa(X
i
)) for each possible value x
i
of X
i
, and pa(X
i
) of Pa(X
i
), where
pa(X
i
) is the set of values of Pa(x
i
). These conditional probabilities are represented in
matrices, here on called conditional probability matrices (CPMs). Using a Bayesian
network, it is possible to answer questions such as what is the probability of X = x
1
given that Y = y
2
and Z = z
1
. An example of a Bayesian network and a CPM repre-
senting the chance nodes X, Y, and Z is shown in Fig.
2. The CPM next to the network
answers the question
()
121
,| zyxP
stated above. More comprehensive treatment on
Bayesian networks can be found in the literature [11], [18], [21], [24]. The generic
process for constructing Bayesian networks consists of three steps to define the nodes,
relations and conditional probability matrices. These are described in the context of IT
governance performance prediction in the following sections.
Y Z
X
y
1
y
2
y
3
y
1
y
2
y
3
y
1
y
2
y
3
x 1 P(x 1 | y 1,z 1)P(x1 | y 2,z 1 )P(x1 | y 3 ,z 1 )P(x1 | y 1 ,z 2)P(x1 | y 2 ,z 2)P(x1 | y 3 ,z 2 )P(x1 | y 1 ,z 3 )P(x1 | y 2 ,z 3 )P(x1 | y 3 ,z 3 )
x
2 P(x 2 | y 1,z 1 )P(x2 | y 2 ,z 1 )P(x2 | y 3,z 1)P(x2 | y 1,z 2 )P(x2 | y 2 ,z 2 )P(x2 | y 3 ,z 2 )P(x2 | y 1 ,z 3 )P(x2 | y 2 ,z 3 )P(x2 | y 3 ,z 3 )
x
3
P(x
3
| y
1
,z
1
)P(x
3
| y
2
,z
1
)P(x
3
| y
3
,z
1
)P(x
3
| y
1
,z
2
)P(x
3
| y
2
,z
2
)P(x
3
| y
3
,z
2
)P(x
3
| y
1
,z
3
)P(x
3
| y
2
,z
3
)P(x
3
| y
3
,z
3
)
z
2
z
3
Y
X
Zz
1
Fig. 2. A Bayesian network and the conditional probability matrix for X given Y and Z.
172

3 Defining Nodes
It was decided to base the predictive Bayesian network on COBIT, as the framework
provides the most relevant and detailed support for IT governance. The motivation for
this choice can be found in previous publications [25], [26].
The concept of IT governance as consisting of processes, activities, roles, docu-
ments and metrics was adopted from COBIT. The use of processes to describe an IT
organization is commonly employed in many frameworks, and is also used in the
herein proposed approach. Further, each process contains one or more activities,
which represent the actual content of the work performed within the IT organization.
The documents correspond to process inputs and outputs as stated in COBIT. Metrics
are used to monitor the execution of each process, and a representation for metrics
monitoring is also incorporated. The concept of Roles being responsible, accountable,
consulted or informed on the execution of different activities is also incorporated. The
role representation features the distinction between executives, business and IT as
stated by Weill & Ross and IT Governance Institute, [10], [30] but also employs IT
operations and audit roles taken from COBIT [9].
Indicators for IT governance maturity, as seen from IT’s viewpoint, can be ob-
tained by gathering information on the above mentioned entities for each IT process.
Then, the activity execution (A), metrics monitoring (M), documents in place (D),
and the responsibility assignment (R) can be evaluated according to previous work by
Simonsson [26]. These four are represented as chance nodes with maturity levels
ml0-ml5 in the Bayesian network for IT governance performance prediction. The
entire IT organization is represented by means of 136 different nodes, so called IT
governance maturity indicators, that together form the 34 processes detailed in
COBIT. As mentioned earlier the purpose of the Bayesian network is not solely to
study the IT organization in terms of controllable maturity indicators bur also to pre-
dict the uncontrollable business perception of IT governance performance by study-
ing the controllable IT governance maturity indicators, cf. Fig. 1. Weill & Ross have
previously determined IT governance performance in 250 organizations by means of
letting senior management judge their organization’s performance with respect to two
objectives [30], cf. Table 1. The same objectives have been used in the research pre-
sented in this paper.
Table 1. Objectives employed in order to represent the IT governance performance node
in the Bayesian network [30].
O1. How important are the following outcomes
of your IT governance, on a scale from 1 (not
important) to 5 (very important)?
Cost effective use of IT
Effective use of IT for growth
Effective use of IT for asset utilization
Effective use of IT for business flexibility
O2. What is the influence of IT governance in your
business on the following measures of success, on a
scale from 1 (not successful) to 5 (very successful)?
Cost effective use of IT
Effective use of IT for growth
Effective use of IT for asset utilization
Effective use of IT for business flexibility
Weill & Ross’ objectives were aggregated and transformed into performance levels
pl0-pl5 for the node ITG_Performance according to Formula (1).
173

⎟
⎟
⎠
⎞
⎜
⎜
⎝
⎛
−=
∑
∑
=
=
1
1
2*1
25.1_
4
1
4
1
n
n
n
nn
Q
QQ
ePerformancITG
(1)
4 Defining Relations
In order to use a Bayesian network for predictions, not only knowledge about differ-
ent nodes and their maturity levels or intrinsic performance levels is needed. It is also
necessary to define how the nodes are related. The processes in COBIT well delimit
the scope of the work performed by the IT organization [26]. The IT processes are
controllable by IT management, and it is reasonable to believe that the maturity of an
IT process is causally linked to the IT governance performance, but the IT processes
are not measurable. However, each process consists of different activities, documents,
metrics, roles and responsibilities. These are controllable by IT management and
measurable in terms of IT governance maturity indicators. A causal relation exists
between the IT governance maturity indicators, and the IT processes.
By determining only the maturity of one or more of the indicators as discussed in
Section 3, the network can predict IT governance performance, which is the idea
behind the Bayesian network, cf. Fig.
3. The strength of the causal relations in the
network is mathematically described as CPMs.
PO1_ITProcessMaturity
ITG_Performance
ME4_ITProcessMaturity
PO1_A PO1_M PO1_D PO1_R ME4_A ME4_M ME4_D ME4_R
...
Fig. 3. The Bayesian network for IT governance maturity prediction features
34 IT Process Maturity nodes ranging from PO1 to ME4 [9].
5 Defining Conditional Probability Matrices
The CPMs defining the chance nodes in the network must be learned, i.e. the parame-
ters in the matrices need to be determined. The basic approach is to collect empirical
data for the nodes by conducting case studies and then use Bayesian network learning
algorithms to assign the parameters to the matrices.
5.1 Requirements on Methods for Learning Bayesian Networks
There are several methods for learning Bayesian networks. This subsection presents a
set of requirements that has been used in order to evaluate the four methods in focus
of this paper. Performing case studies is a time consuming activity, which is also
highly dependent on the number of accessible cases. The amount of data sets that the
174

network can learn from is often limited. Therefore, the learning method must be able
to obtain conditional probabilities based on a fairly small number of datasets. As
discussed previously, the structure of the network has already been determined and a
learning method should not change it. In other words, the user herself should be able
to choose network structure. The desired ability to learn conditional probabilities
without changing the structure of the network is denoted parameter learning. Finally,
it is deemed that the output of the method should be a conditional probability matrix.
5.2 Evaluation of Methods for Learning Bayesian Networks
Four methods have been evaluated, including the Expectation Maximization (EM), B-
Course, Path Condition (PC), and the Necessary Path Condition (NPC) algorithms.
The evaluation is focused on the requirements presented in the previous subsection,
namely support for learning from a limited number of data sets, parameter learning,
user choice of structure, and method outcome.
The most common method for learning Bayesian networks with statistical data is
called the EM algorithm [3],[14]. The main disadvantage with EM learning is that,
when using only a small number of datasets, the learning will result in conditional
probability matrices with zero entries. This means that if a set of values has not ap-
peared in any of the learning cases, the set cannot be used for prediction.
B-course is a web-based online data analysis method proposed by Myllymäki [17]
that allows the user to analyze data for multivariate probabilistic dependencies. The
outcome of the method is a Bayesian network structure with learned conditional
probability matrices. The main drawback with this method is that it learns the struc-
ture from data. It is not possible to force an already set structure upon B-course and
only learn the parameters of the variables. B-course also requires large number of
datasets to provide useable conditional probability matrices.
The PC algorithm is a constraint-based learning algorithm. This means that the al-
gorithm uses statistical tests to derive a set of conditional independent and dependent
statements, and learns the structure of a Bayesian network. The NPC algorithm is an
enhancement of the PC algorithm which intends to bridge the latter’s deficiencies in
learning from small number of data sets. Both algorithms have the disadvantage that
their outcomes are structures and not CPMs [16].
To summarize, the main requirement is that the method should be able to learn pa-
rameters based on collected data, which excludes the PC and NPC algorithms. Since
data collection in the case of IT governance performance prediction is made through
case studies, a key requirement is the limited amount of data sets available. Neither
the EM algorithm nor B-course addresses this issue. The result of the evaluation of
the methods and the proposed approach is visualized in Table 2. Linear regression is a
commonly used method for prediction of the outcome of one variable based on the
information of other variables [1],[27]. It may thus also be appropriate for learning
conditional probability matrices in Bayesian networks. The main weakness of this
approach is that the outcome of a linear regression is not a conditional probability
matrix, but rather an equation y=ax+b. However, if the outcome of linear regression
could be translated into a CPM, the approach would be appropriate for our purposes.
175

5.3 The Linear Conditional Probability Matrix Generator
Unfortunately, no linear learning approach with conditional probability matrices as
outcome exists in the readily available tools for Bayesian statistics. Therefore, the
Linear Conditional Probability Matrix Generator (LCPMG) was developed. In gen-
eral, LCPMG takes into account gathered observation data, processes it, and returns a
conditional probability matrix made with an assumption of linearity in the input data.
The generator works according the following steps:
Observations on a quantitative scale of measurement are made and a structure is
decided upon. For pedagogic purposes, assume 20 observations of the variable
X
and 20 simultaneous observations of
Y
. The nodes
X
and
Y
are causally related to
one another in the network,
X
affecting
Y
. The observed values are on a continuous
scale
[]
5...0∈
i
x
and
[]
5...0∈
i
y
. The choice of scales of measure is due to the equally
graded scales for IT governance maturity assessment used in the COBIT framework [9].
A linear regression on the observations is performed according to standard proce-
dures described by e.g. Cohen and Walsh [1],[27]. The result is an equation
baXY
estimate
+=
, where a and
b
are scalar constants. The residuals constitute the
difference between the linear approximation that is fitted to the observations
()
ii
YX ,
,
and the actual observations
estimate
YYR
−
=
. The standard deviation S of the residuals,
an approximation of the certainty with which the linear approximation is made, is
calculated. The purpose of the LCPMG is to generate a discrete CPM from a continu-
ous linear approximation
estimate
Y . In order to do that, six different ranges for y
i
are
created:
5.55.45.35.25.15.05.0
543210
<
≤
<
≤
<
≤
<
≤
<≤<≤− yyyyyy
,
[]
5,4,3,2,1,0
∈
i
x
.
Based on the linear approximation and the standard deviation S, the probability mass
P(y
i
| x
i
) in each cell of the CPM is calculated. The total probability
1)|(
5
0
=
∑
y
y
i
xyP
for each
[]5,4,3,2,1,0
∈
x
. As an example, if the linear approximation is
15.0 += xy
estimate
, and the standard deviation for the residual vectors equals
5.0
, this
corresponds to P(
2
y
|
2
x
) = 68.27 % [1]. In summary, the LPCMG has now trans-
formed two arrays with observations on a continuous scale, to a CPM describing the
causal relation between two nodes in a Bayesian network. Returning to the require-
ments on methods for learning Bayesian networks and comparing the LCPMG to
other already available methods one finds that the LCPMG fulfills all four require-
ments. Table 2 shows a final comparison of some common learning approaches for
Bayesian networks and the here proposed LCPMG.
Table 2. A comparison of different learning approaches for Bayesian networks.
Requirement
Method
EM Algorithm B-Course PC Algorithm NPC Algorithm LCPMG
ĆĆ
ĆĆ Ć
ĆĆ
CPM CPM & Structure Structure Structure CPM
Support for learning from a
limited number of data sets
User choice of structure
Method outcom e
Param eter learning
176

5.4 Using LCPMG for Creation of a Bayesian Network for IT Governance
Performance Prediction
The LCPMG is suitable for generating the CPMs of nodes that are linearly related to
one another. In the case of IT governance maturity prediction, the Bayesian network
has three hierarchical levels. The first level contains the measureable, yet not control-
lable IT governance performance node. The second level contains 34 IT process
nodes that are controllable, but not measureable. On the third level, 136 measureable
and controllable IT governance maturity indicator nodes reside, cf. Fig. 1. The CPMs
of all nodes at all levels must be defined, and the LCPMG can be applied stepwise in
order for the network to learn the CPMs.
Calculate the regressions for all IT governance maturity indicator nodes and the IT
governance performance node. Use the regressions to assign normalized weights w
i
to
each of the four node types; activities, metrics, documents and responsibilities.
The maturity for an IT process, m
p
, can be calculated as
prpdpmpap
rmlwdmlwmmlwamlwm _*_*_*_* +++=
. Calculate the m
p
for each of the
N*34 IT processes, where N represents the number of different observations made.
Use LCPMG to determine the CPMs for each of the 34 IT process nodes, based on
the m
p
:s and the ITG_Performance node. Use LCPMG to determine the CPMs for
each of the 136 maturity indicator nodes, based on maturity levels for the maturity
indicators, and the m
p
:s. Finally, the prior of the ITG_Performance node is set by
analyzing the occurrence of each one of the possible levels pl0-pl5.
CPM for PO4 and ITG_Performance (rounded)
pl0 pl1 pl2 pl3 pl4 pl5
ml5 0,01 0,01 0,01 0,02 0,06 0,17
ml4 0,01 0,01 0,04 0,13 0,26 0,39
ml3 0,03 0,10 0,22 0,35 0,40 0,33
ml2 0,19 0,32 0,40 0,35 0,23 0,10
ml1 0,42 0,39 0,27 0,14 0,05 0,01
ml0 0,35 0,18 0,07 0,02 0,01 0,01
Fig. 4. Calculations of IT process PO4’s maturity and observations of ITG_Performance (small
dots), the linear approximation of the relation between them (ITG_Performance = 0.60*PO4 +
0.69, S = 0.96), and how these fit into the CPM (colored bubbles). The resulting CPM is shown
to the right.
S denotes the standard deviation of the residuals [1],[27]. A small S indicates a good
fit to the linear model. If only a limited amount of datasets have been used in order
for the Bayesian network to learn, all levels of ITG_Performance have perhaps not
been observed. This can be corrected for by using Laplace’s estimation, i.e. add 1 to
the number of observations assigned to each state [10]. In this way, no zeros will be
present in the resulting CPM and it is thus resulting in a better and more smoothly
predicting Bayesian network. Fig.
4 shows observations for Y = PO4 (Define the IT
processes, Organization and Relationships) and X = ITG_Performance, the linear
approximation and a graphic representation of the probability mass for each cell in
177

the CPM. The darker red the color of a bubble, the higher the probability mass P(y
i
|x
i
)
of the corresponding cell in the CPM.
6 Discussion & Conclusions
As of March 2008, about 160 interviews have been conducted within in 35 different
organizations. The collected data spans a variety of industries, including banks, the
public sector, telecommunications, electric utilities and manufacturing. The LCPMG
has been applied upon the collected data in order for the Bayesian network for IT
Governance Performance to learn. In spite of the variety of empirical data, correla-
tions between IT governance performance and IT governance maturity indicators are
clearly visible, and the Bayesian network is already usable for making predictions.
Based on the current sets of data it seems that the maturity indicators that most
strongly correlate with IT governance performance do not differ among industries. In
summary, this paper has been discussing the use of Bayesian networks for prediction
of IT governance performance. The Linear Conditional Probability Matrix Generator,
LCPMG, is proposed as a way for Bayesian networks to learn from small datasets.
The resulting network can be employed to make well-informed decisions regarding
IT governance performance. Finally, the authors would like to thank Professor Stefan
Arnborg for his valuable input on Bayesian statistics.
References
1. Cohen, J., Cohen, P.: Applied Multiple Regression/Correlation Analysis for the Behavioral
Sciences. Lawrence Erlbaum Associates. (1983)
2.
Debraceny, R.S.: Re-engineering IT Internal Controls - Applying Capability Maturity
Models to the Evaluation of IT Controls. Proceedings of the 39th Hawaii International
Conference on System Sciences. (2006)
3.
Friedman, N.: The Bayesian Structural EM Algorithm. In Proceedings of the Fourteenth
Conference on Uncertainty in Artificial Intelligence (UAI '98), San Francisco, United
States. (1998)
4.
Friedman, N., Linial, M., Nachman, I., Pe’er, D.: Using Bayesian Networks to Analyze
Expression Data. Journal of Computational Biology. 7(3-4) (2000) 601-620
5.
Guldentops, E.: Governing Information Technology through COBIT. In: Van Grembergen, W.
(ed.): Strategies for Information Technology Governance. Idea Group Publishing (2004)
6.
Hendersen, J.C., Venkatraman, N.: Strategic Alignment: Leveraging Information Technol-
ogy for Transforming Organizations. IBM Systems Journal, Vol. 32(1) (1993) 472-485
7.
Holm Larsen, M., Kühn Pedersen, M., Viborg Andersen, K.: IT Governance – Reviewing
17 IT Governance Tools and Analyzing the Case of Novozymes A/S. Proceedings of the
39th Hawaii International Conference on System Sciences. (2006)
8.
International Organization for Standardization.: ISO/IEC 20000-1 & ISO/IEC 20000-2.
(2005)
9.
IT Governance Institute.: Control Objectives for Information and Related Technology, 4
th
Edition, http://www.itgi.org. (2005)
10.
IT Governance Institute.: Val IT Framework, http://www.itgi.org. (2007)
11.
Jensen, F.: Bayesian Networks and Decision Graphs. Springer-Verlag (2001)
178

12. Johnson, P., Lagerström, R., Närman, P., Simonsson, M.: Enterprise Architecture Analysis
with Extended Influence Diagrams. Information Systems Frontiers, Vol. 9, No. 2, 2007.
13.
Korac-Kakabadse, N., Kakabadse, A.: IS/IT Governance: Need For an Integrated Model.
Corporate Governance 4 (1). (2001) 9-11
14.
Lauritzen, S.: The EM Algorithm for Graphical Association Models with Missing Data.
Computational Statistics and Data Analysis, Vol. 19. (1995) 191-201.
15.
Loh, L. and N. Venkatraman.: Diffusion of Information Technology Outsourcing: Influ-
ence Sources and the Kodak Effect. Information Systems Research 3(4) (1992) 334-359.
16.
Madsen, A., Lang, M., Kjaerulff, U., Jensen, F.: The Hugin Tool for Learning Bayesian
Networks. Symbolic and Quantitative Approaches to Reasoning with Uncertainty, Vol.
2711. Springer Berlin/Heidelberg (2004) 594-605.
17.
Myllymäki, P., Silander, T., Tirri, H., Uronen, P.: B-Course: A Web-Based Tool for Bayes-
ian and Causal Data Analysis. International Journal on Artificial Intelligence Tools, Vol.
11 (2002) 369-387
18.
Neapolitan, R.: Learning Bayesian Networks. Prentice-Hall (2003)
19.
Office of Government Commerce.: IT Infrastructure Library Service Delivery. The Sta-
tionery Office (2003)
20.
Office of Government Commerce.: Service Strategy Book. The Stationery Office (2007)
21.
Pearl, J.: Probabilistic Reasoning in Intelligent Systems: Networks of Plausible Inference.
Morgan Kaufmann (1988)
22.
Ridley, G., Young, J., Carroll, P.: COBIT and its Utilization - A Framework from the
Literature. Proceedings of the 37th Hawaii International Conference on System Sciences,
Hawaii. (2004)
23.
Ross, J.W.: Creating a Strategic IT Architecture Competency - Learning in Stages. MIT
Sloan School of Management Working Paper No. 4314-03. (2003)
24.
Shachter, R.: Probabilistic inference and influence diagrams. Operations Research, 36(4)
(1988) 589-604
25.
Simonsson, M., Johnson, P., Wijkström, H.: Model-based IT governance maturity assess-
ments with Cobit. Proceedings of the European Conference on Information Systems.
(2007)
26.
Simonsson, M., Johnson, P.: The IT Organization Modeling and Assessment Tool: Corre-
lating IT Governance Maturity with the Effect of IT. Proceedings of the 41:st Hawaii Inter-
national Conference on System Sciences, Hawaii, United States (2008)
27.
Walsh, C.: Statistics for the Social Sciences with Computer Applications. Harper & Row
Publishers (1990)
28.
Warland, C., Ridley, G.: Awareness of IT Control Frameworks in an Australian State Gov-
ernment: A Qualitative Case Study. Proceedings of the 38th Hawaii International Confer-
ence on System Sciences, Hawaii. (2005)
29.
Weill, P., Woodham, R.: Dont Just Lead, Govern: Implementing Effective IT Governance.
MIT Sloan School of Management Working Paper No. 4237-02 (2002)
30.
Weill, P., Ross, J.: IT Governance – How Top Performers Manage IT Decision Rights for
Superior Results. Harvard Business School Press (2004).
179
