
TOWARDS A VALUE-ORIENTED APPROACH TO
BUSINESS PROCESS MODELLING
Jan vom Brocke
Martin Hilti Chair of Information Systems and Business Process Management (IS&BPM)
University of Liechtenstein Vaduz, Liechtenstein
Jan Mendling, Jan Recker
BPM Group, Enterprise Systems Cluster, Queensland University of Technology, Brisbane, Australia
Keywords: Process re-engineering, value-orientation, process modelling, total cost of ownership, return on investment.
Abstract: To date, typical process modelling approaches put a strong emphasis on behavioural aspects of business op-
erations. However, they often neglect value-related information. Yet, such information is of key importance
to strategic decision-making, for instance in the context of process re-engineering. In this paper we propose
a value-oriented approach to business process modelling that facilitates managerial decision-making in the
context of process re-design based on concepts and metrics from financial and operations management.
1 INTRODUCTION
Over recent decades, business process management
(BPM) has emerged as a popular management
approach in information systems and business
management practice. BPM has over the last three
years continuously been identified as a top business
priority and building business process capability
continues to be a major challenge for senior
executives in the coming years (Gartner Group,
2007). Most notably, BPM practices are employed to
improve, re-design or re-engineer existing business
operations so as to improve overall effectiveness or
efficiency of an enterprise. In fact, a recent survey
on BPM initiatives confirmed that 75% of active
BPM projects are concerned with process
improvement (Palmer, 2007).
A key challenge in process improvement projects
is the initial discovery and description of the
business operations in a manner that is conducive to
process improvement (Burlton, 2001). In this
context, process modelling as an approach to
graphically articulate the activities, events or states,
and control flow logic that constitute a business
process is typically employed to discover existing
processes, and document them in a way that helps
managers making improvement or change decisions
(Recker, 2007; Rosemann, 2006).
However, the graphical description of events,
tasks, control flow logic and the like does actually
little in helping managers making change decisions.
What is missing in process modelling practice is a
focus on business value considerations. More
precisely, popular process modelling approaches,
such as ARIS (Scheer, 2000), provide a reasonably
good understanding of what is happening in the
process – but reveal only little about the financial
consequences of the operations, and how changes to
these operations would contribute – or not – to
corporate success. Surprisingly, also existing
apporaches in process simulation, e. g., Greasley
(2000), or process mining, e. g., van der Aalst
(2005) hardly consider financial information.
The question then is how to leverage process
modelling for the assessment of the business value
of processes (or process changes). In particular,
long-term monetary consequences which are
influenced by market and resource-related stimuli,
should be taken into account for process
improvement. In order to assess the value of a
process with regard to long-term economic
consequences, decisions on the process design have
to be considered as an investment (Devaraij and
Kohli, 2002).
Accordingly, the imperative of our research is to
identify and to describe the different aspects that
contribute to the long-term financial value of a
380
vom Brocke J., Mendling J. and Recker J. (2008).
TOWARDS A VALUE-ORIENTED APPROACH TO BUSINESS PROCESS MODELLING.
In Proceedings of the Tenth International Conference on Enterprise Information Systems - ISAS, pages 380-385
DOI: 10.5220/0001713803800385
Copyright
c
SciTePress

process design. In particular, we propose a
framework that distinguishes three levels of
evaluation, viz., the operational, the budgeting, and
the corporate level. Furthermore, we show how these
different financial dimensions can be identified by
the help of a process model, and how this financial
data relates to process change decisions. Overall, we
call this approach value-oriented process modelling.
We proceed as follows. First, we give an
example of a typical process design scenario and
highlight how and why existing approaches fail to
provide adequate information for process change
decision-making. Then, in Section 3 we introduce
our framework of financial dimensions of a business
process design. In Section 4, we describe in detail
our approach for identifying different financial
aspects in business process models by means of
exemplary methods. We conclude in Section 5 with
an outlook to future work.
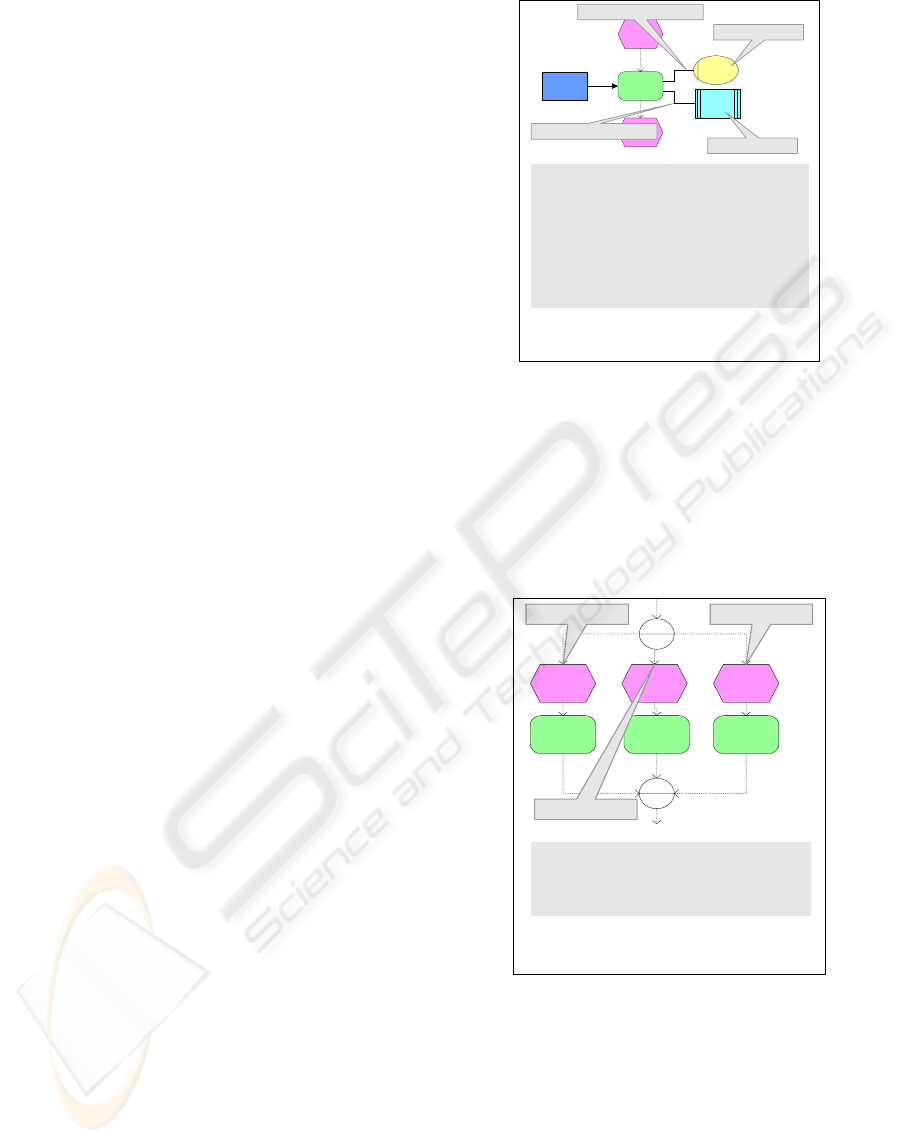
2 A MOTIVATING EXAMPLE
Figure 1 depicts a garage fabrication process de-
scribed in Anupindi et al. (1999) as an Event-driven
Process Chain (EPC) (Scheer, 2000). The EPC is a
modelling technique for the representation of tempo-
ral and logical dependencies of activities in a busi-
ness process. The EPC denotes one of the most
popular approaches to process modelling and are
heavily used in practice (Davies et al., 2006), which
is why we use them for illustration purpose. EPCs
include function type elements that can be used to
capture activities of a process and event type ele-
ments that describe pre- and post-conditions of these
functions. Furthermore, there are three kinds of con-
nector types in EPCs to specify the control flow
logic of a process. For details refer to Mendling and
van der Aalst (2007).
In essence, the garage fabrication process shown
in Figure 1 starts when a garage has to be assembled.
In concurrency (AND-split), the purchased parts
have to be taken out of the warehouse and the roof
has to be fabricated in two steps. Both these inputs
are required for the assembly of the garage. Only
then, the assembled garage can be put into the ware-
house. For each of the EPC functions there are two
operations metrics annotated: first, the flow time
(i.e., the number of garages or parts required for a
garage per week), and second, the flow rate (i.e., the
number of units in dollar that flow through a specific
function per week).
Garage to be
assembled
V
Take
purchased
parts out of
warehouse
Take roof raw
materials out
of warehouse
Fabricate roof
Parts available
Raw materials
available
V
Roof available
Assemble
garage
Garage
assembled
Put garage in
warehouse
Garage in
warehouse
11.12 #/week
0.77 $/week
6.75 #/week
0.96 $/week
7.12 #/week
2.12 $/week
3.14 #/week
3.38 $/week
2.90 #/week
3.38 $/week
Figure 1: EPC of a garage fabrication process.
It should be noted, however, that in many con-
temporary business process modelling projects nei-
ther of these two flow metrics are actually measured
let alone described in a process model. At best, flow
times are collected. Consider now a procedure to
business process improvement that takes flow times
into account. In a naive and ad-hoc approach, one
might argue to focus improvement efforts on the
function that takes the longest time. Assume that this
way the flow time of, let’s say, the ‘purchase parts’
function can be reduced from 11.12 units per week
to 10 units per week. As Figure 1 shows, however,
the flow time reduction does not improve the cycle
time of the overall process since the purchase parts
function is not on the so-called critical path – the
reason is that the roof fabrication takes longer
(6.75+7.12 units per week). And indeed, operations
management (Anupindi et al., 1999) informs us that
such an approach takes too narrow a stance. Instead,
the appropriate criterion to check would be the in-
ventory of each activity. The average inventory can
be calculated according to Little’s law as the product
of average flow rate multiplied with the average
flow time. Accordingly, in the garage fabrication
process the function ‘fabricate roof’ has the highest
inventory with 7.12 #/week * 2.12 $/# = 15.1 $/
week. But even if we follow this operations man-
agement approach, we still miss investments in the
business process infrastructure and tax aspects.
Changing the process design might impact these di-
mensions as well.
TOWARDS A VALUE-ORIENTED APPROACH TO BUSINESS PROCESS MODELLING
381
This small example illustrates the need for taking
financial data into account when making decisions
on business process change. While several authors in
operations management and investment theory (e. g.,
Anupindi, et al., 1999) discuss the financial impact
of changing business processes, these insights are
hardly reflected in recent research let alone practice
on business process modelling. Accordingly, in the
next section, we sketch the integral parts of a system
intended to lend better support.
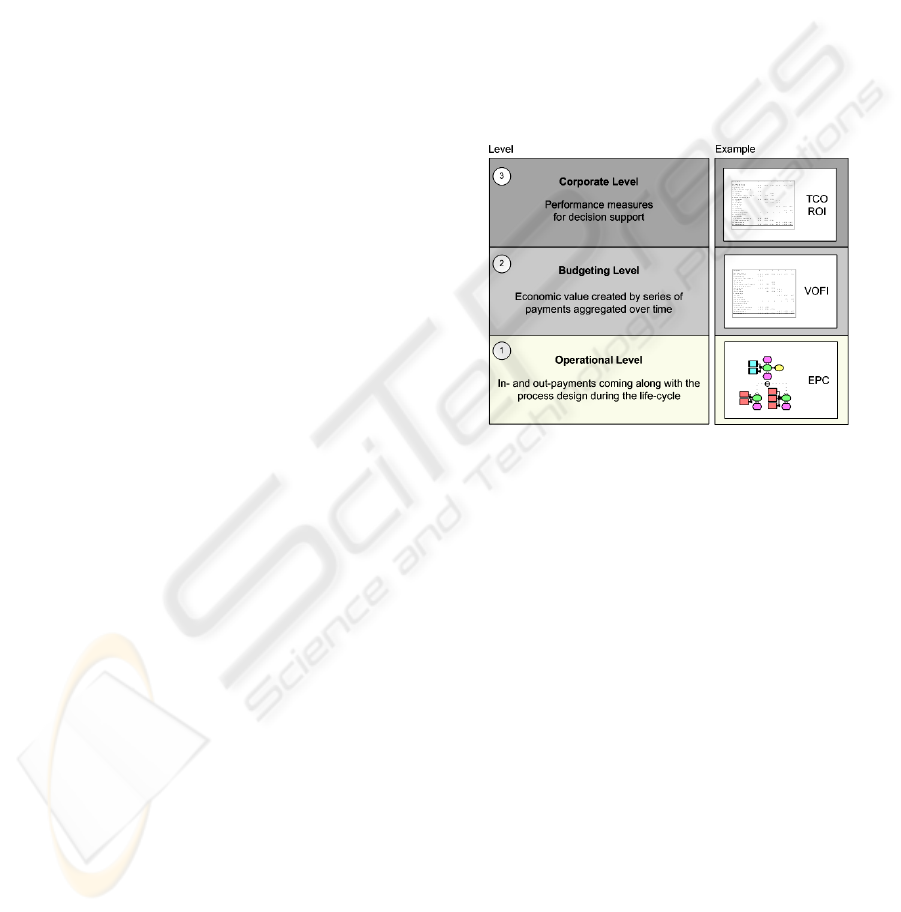
3 A GENERAL FRAMEWORK
The measurement system presented in this paper dis-
tinguishes three levels of evaluation: the operational
level, the budgeting level, and the corporate level
(see Figure 2). The operational level serves to collect
payments relevant to a specific process design. The
economic value of these payments referring to a
company’s situation is subsequently evaluated, first
on the budgeting, and then on the corporate level.
The budgeting level aggregates payments of process
designs over time and the corporate level condenses
the data to key performance indicators that can form
the basis for decision-making.
On the operational level payments (out-
payments) and receivables (in-payments) are calcu-
lated. They can be directly assigned to decisions on
the process design (consider, for instance, payments
driven by the process performance). Obviously,
these payments considered to be relevant in a spe-
cific situation may vary according to a specific deci-
sion situation. Research in the field of value-based
business process management focuses on the analy-
sis of typical situations in order to derive sets of pay-
ments representative for certain application areas.
On the budgeting level, additional parameters are
taken into account for establishing the economic
value created by respective series of payments.
Relevant parameters are derived from specific con-
ditions of funding and tax obligations that a com-
pany has to meet. These series of payments are con-
solidated over time by applying methods of capital
budgeting (Grob, 1993; Seitz and Ellison, 2004;
Shapiro, 2004). That way, a survey of financial con-
sequences is created.
Finally, on the corporate level, the profitability
of a process design and operation has to be judged
by condensing the aggregated economic process data
into key performance indicators. Measures like the
Total Cost of Ownership (TCO) and the Return on
Investment (ROI) help to consider relevant parame-
ters for this purpose (Seitz and Ellison, 2004;
Shapiro, 2004; Gartner Group, 2003).
As for the budgeting and corporate level, well-
established measurement systems already exist
(Grob, 1993; Shapiro, 2004). Our framework is de-
signed to integrate these methods from financial
management into the context of process re-design.
This allows measuring the financial implications of a
process design. In doing so, however, the challenge
is to find relevant in- and out-payments on the op-
erational level. One promising approach in this con-
text could be the use of Activity-based Costing,
(Sapp, Crawford and Rebishcke, 1998), which is a
method to decompose cost measures alongside the
activities of a business process to identify critical
cost drivers.
Figure 2: Framework for Measuring the Economic Process
Value (EPV).
Still, we have to note that the notion of ‘corpo-
rate success’ typically transcends beyond financial
measures. The Balanced Scorecard approach, for in-
stance, takes multiple perspectives into considera-
tion (Kaplan and Norton, 1992). It distinguishes four
perspectives of performance measurement, including
’Financial’, ’Customer’, ’Internal Business Proc-
esses’, and ’Learning & Growth’. Of these, we focus
on the financial perspective, which measures the
economic value generated within the other perspec-
tives, in particular by improvements to business
processes.
4 METHODICAL SUPPORT
4.1 Preliminaries
This section discusses the systematic consideration
of relevant process payments. Our approach is based
on the observation that in every process, each and
every function brings about payments (out-
ICEIS 2008 - International Conference on Enterprise Information Systems
382
payments) and receivables (in-payments). The ap-
proach we propose is to estimate these and aggregate
them based on the overall process structure.
The method provided in this chapter sets certain as-
sumptions for covering this task:
Costs lead to in- and out-payments. The reason
for this is that multiple time periods are consid-
ered. Accordingly, factor input and/or creation
has long term consequences on capital costs.
Capital costs are dependent on capital stock that
is influenced by means of payments (and not by
means of costs and performances).
Costs have to be allocated to a process. Calcu-
lating the value of a single process implies that
relations to various other processes have to be
taken into account. Here, payments are calcu-
lated in relation to the process they are caused
by.
Against the background of these preliminaries, ex-
emplary methods for the value assessment of busi-
ness processes on each layer shall now be presented.
4.2 Measurement on the Operational
Level
Payments can be calculated according to different
schemas. In this section, basic operations for calcu-
lating out-payments are presented. Factors serving as
input in the process are identified and assessed. As
to the apportionment, factors for both consumption
and usage have to be distinguished. Factors of con-
sumption are objects that are consumed by func-
tions. Factors of usage, however, are objects of input
that serve as resources for processing a function.
They can either be calculated fully or partitioned ac-
cording to certain keys. The concept of the prevail-
ing calculation is shown in Figure 3.
Out-payments of a function are assembled by
payments for the required objects of usage as well as
the objects of input that were consumed in the exe-
cution of the function. We assume that the payments
are aggregated per period such that they capture the
operational inventory. In order to calculate objects
of input, the amount (and type) of the objects ap-
plied in the function have to be accounted for. In or-
der to assess out-payments, the amounts have to be
multiplied by the cost per unit. The payment for ob-
jects of usage is calculated according to the fre-
quency-of-utilisation principle. This procedure is
similar in application to the procedure of activity-
based costing. That is, the percentage of resource-
utilisation of a function is calculated. For this calcu-
lation, resource units that are used by a certain func-
tion are proportional to the total sum of all units
provided by this resource (see Figure 3).
ii
i
1
,
i
1
,
i
ject]essourceob[Payment.R]nputobject[Payment.I
Payment][
]bject.CostRessourceo[ge]object.Usa[Ressource
ject]essourceob[Payment.R
t.Price]Inputobjec[ct.Amount][Inputobje
]nputobject[Payment.I
+=
⋅=
⋅=
∑
∑
=
=
m
j
jji
q
p
ppi
[Function]
i
[Ressour-
ceobject]
1
[Ressour-
ceobject]
2
[Inputobject]
1
[Ressourceobject.Cost]
1
[Ressourceobject.Cost]
2
[Ressourceobject.Usage]
1,2
[Ressourceobject.Usage]
1,1
Symbols
i Index for Functions
p Index for Objects of Input
j Index for Objects of Resource
Figure 3: Calculating out-payments.
Payments related to functions now need to be
aggregated for each specific process and each period
within the planning-horizon. Generally, payments of
all functions have to be added. In case of process
branches in which an alternative processing takes
place, the probability of branches has to be consid-
ered (see figure 4).
∑
=
⋅=
n
i
i
1
i
g
ty][ProbabiliPayment][Function.
yment]Process.Pa[
[Function.
OR]
1
[Function.
OR]
3
OR
OR
[Fun ction.
OR]
2
[Probability]
1
[Event]
1
[Ev en t]
2
[Ev en t]
3
[Probability]
2
[Probability ]
3
Symbols
i Index for Functions
g Index for the Excerpt of a Process
Figure 4: Aggregating Payments.
In order to investigate the probability, relative
frequencies can be estimated in which events re-
occur when instantiating the process multiple times.
While probabilities of all events related to a branch
clearly have to sum up to one in case of an XOR
connector, the sum of rates can differ from 100% in
the case of OR connectors.
In order to partition both in- and out-payments
on various periods during the phase of operation,
TOWARDS A VALUE-ORIENTED APPROACH TO BUSINESS PROCESS MODELLING
383
constant trend rates can be applied. In addition, spe-
cial payments can also be planned explicitly and in-
cluded in the calculation.
4.3 Measurement on the Budgeting
Level
On the budget-level, the financial consequences are
measured that are derived by the payments on the
operational level. For that purpose, the method of
´Visualisation Of Financial Implications´ (VOFI)
can be applied (Grob, 1993). Using VOFI, the finan-
cial consequences of long-term decisions are struc-
tured and calculated by means of spreadsheets that
serve as a database for further analysis. Compared to
formulas applied by conventional methods of capital
budgeting (e.g., Present Value or Annuity of an In-
vestment Project), calculating the investment on the
basis of a spreadsheet offers greater transparency
and adaptability (vom Brocke and Lindner, 2004). A
template of an appropriate VOFI is illustrated in
Figure 5.
Point in Time 0 1 …n… h
Series of Pa
y
ments
Internal Funds
– Withdrawals
+ Deposits
Instalment Loan
+ Credit Intake
– Redemption
– Debitor Interest
Annuit
y
Loan
+ Credit Intake
– Redemption
– Debitor Interest
– Creditor Interest
Loan in Current Account
+ Credit Inatake
– Redemption
– Creditor Interest
Financial Investment
– Reinvestment
+ Disinvestment
– Debitor Interest
Tax Pa
y
ments
– Out-Payment
+ In-Pa
y
ment
Accountin
g
Balance 0 0 0 0
Balance on
instalment loan
annuity loan
current account
financial investment
Net Balance
[Final Value]
VOFI for Profitability of Business Processes
Figure 5: Template for Calculating the Financial Conse-
quences of Processes.
The calculation shown in Figure 5 is to be re-
peated for each considered period. With this algo-
rithm, the value of an investment in the implementa-
tion of a to-be model of a process can be monitored
across its life-cycle by observing the net balance in
each relevant period. The net balance of period t=n
is then the final value of the investment.
4.4 Measurement on the Corporate
Level
Apart from general measures provided by capital
budgeting, other measures can be calculated associ-
ated with specific aspects or relevance to process
management. We cannot detail these measures at
this stage and instead refer the reader to the discus-
sion in (vom Brocke, 2007).
The approach described here is not restricted to
the assessment of single business processes. Rather,
it can be used to facilitate decision-making between
different process designs. And indeed, economic
process value in a narrow sense can only be assessed
properly when at least two alternatives are com-
pared: taking a certain decision or not taking this de-
cision – or in more practical terms: sticking to the
as-is state or implementing a to-be model.
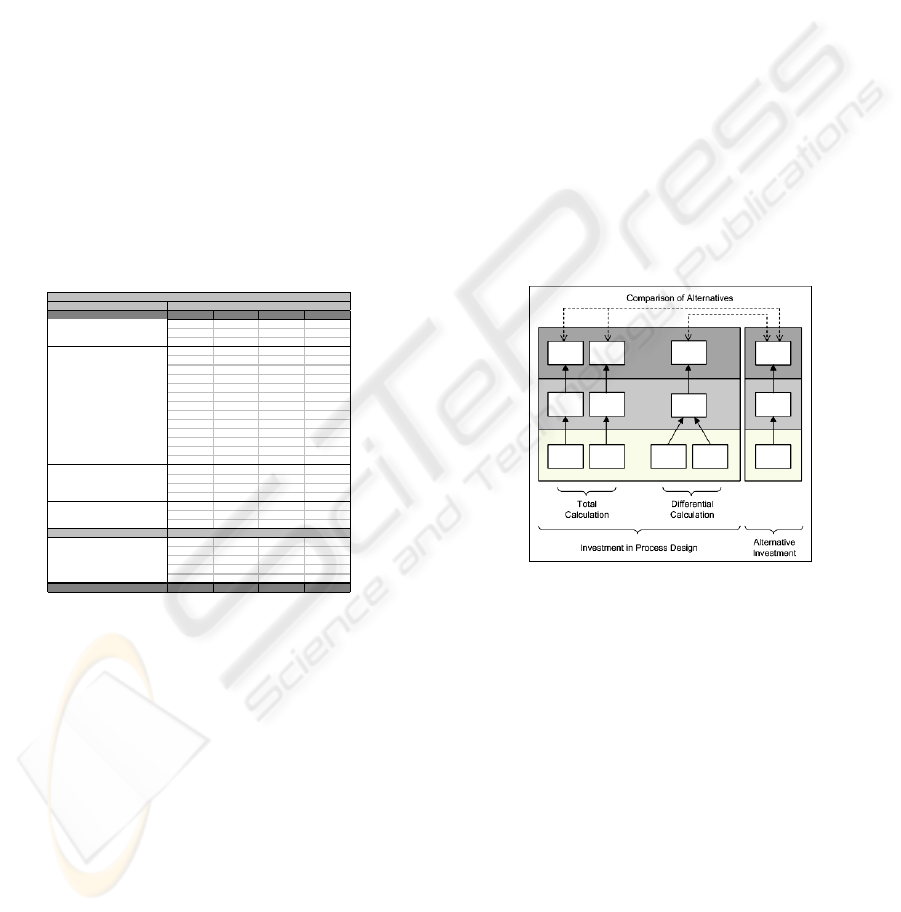
In comparing alternative process designs, two
different approaches can be applied: a total and a
differential calculation (see Figure 6 in contrast to
Figure 2). According to a total calculation scheme,
each process is measured independently. The com-
parison takes place on the corporate level by evalu-
ating the performance measures for each design.
This approach gives a high flexibility, as numerous
alternatives can be compared. However, the effort of
establishing precise value measurements for each
design alternative is substantial.
Figure 6: Comparing alternative Process Designs.
Under the differential calculation scheme, the
idea is to focus only on those additional payments
relevant to the comparison of two alternatives (e. g.,
not the total but only the additional expenditure for
the implementation of a to-be model, compared to
the current state). Accordingly, the comparison is
based on measures collected on the operational
level, whereby only one financial plan and set of
measures is calculated on the corporate level that
represents the added value of one alternative com-
pared to the other. The differential approach, how-
ever, is limited to pair-wise design comparisons.
When comparing more than two alternatives, the ef-
fort related to pair-wise comparisons to be assessed
grows exponentially.
Following either of the two approaches, the re-
sulting measures should be compared with those re-
ICEIS 2008 - International Conference on Enterprise Information Systems
384

sulting for alternative investments (the ‘opportu-
nity’, Grob, 1993). This way, the return of invest-
ments in a process design is compared to the return
on investments in further fields (similar to a finan-
cial investment). Only in comparison, the value of a
process design can be assessed considering the spe-
cific situation of a company.
5 CONCLUSIONS
In this paper we presented and discussed an ap-
proach to extend typical process modelling ap-
proaches with value-related information. This way,
managerial decision-making in the context of proc-
ess management, most notably process improve-
ment, can better be supported. In turn, our approach
presents a stronger business case for process model-
ling. We showed how process modelling can be lev-
eraged to more cohesively and comprehensively
provide stakeholders with financial information re-
quired to assist process change management.
The presented research findings have to be con-
textualised in light of some limitations. Most nota-
bly, our elaborations have been of analytical and
conceptual nature and lack empirical testing. How-
ever, our endeavour was to amalgamate existing,
proven practices from both process management and
financial management practice. Nevertheless, we do
consider empirical evaluation an essential aspect of
our work, and look to validate our approach in the
future by means of case studies with companies en-
gaging in process improvement initiatives and we
look forward to present initial results at ICEIS 2008.
Second, we have not considered other, potentially
relevant, non-monetary measures of process change.
Clearly, values of culture, training, people, govern-
ance, knowledge, resistance to change, leadership
and the like also display pertinence to the success of
process improvement projects.
We do not consider our research complete. We
do hope, however, that we made a case towards
long-needed extensions of process modelling prac-
tice so as to be able to better leverage the graphical
articulation of processes for various types of deci-
sion-making scenarios.
REFERENCES
Anupindi, R., Chopra, S., Deshmukh, S. D., Van
Mieghem, J.A., Zemel, E., 1999. Managing Business
Process Flows. Prentice Hall, Upper Saddle River,
New Jersey.
Burlton, R. 2001, Business Process Management: Profit-
ing From Process. Sams, Indianapolis, Indiana.
Davies, I., Green, P., Rosemann, M., Indulska, M., Gallo,
S., 2006. How do Practitioners Use Conceptual Mod-
eling in Practice? In Data & Knowledge Engineering.
58 (3), 358-380.
Devaraij, S., Kohli, R., 2002, The IT Payoff. Meausring
the Business Value of Information Technology Invest-
ments, FT Press, New York, New York 2002.
Gartner Group, 2003. A Report and Estimating Tool for K-
12 School Districts: Why Total Cost of Ownership
(TCO) Matters. Gartner, Inc, Stamford, Connecticut.
Gartner Group, 2007. Delivering IT’s Contribution: The
2007 CIO Agenda. EXP Premier Report, Gartner, Inc,
Stamford, Connecticut.
Greasley, A., 2000. Effective Uses of Business Process
Simulation. In Proceedings of the 32nd Conference on
Winter Simulation (Eds.: Joines, J. A., Barton, R. R.,
Kang, K., Fishwick, P. A.), Society for Computer
Simulation International, Orlando, Florida, 2004-2009.
Grob, H. L., 1993. Capital budgeting with financial plans,
an introduction, Gabler, Wiesbaden, Germany.
Kaplan, R.S., D.P. Norton, 1992. The Balanced Score-
card: Measures that Drive Performance. In Harvard
Business Review. 70 (1), 71-79.
Mendling, J., van der Aalst, W.M.P., 2007. Formalization
and Verification of EPCs with OR-Joins Based on
State and Context. In Proceedings of the the 19th In-
ternational Conference on Advanced Information Sys-
tems Engineering (Eds.: Krogstie, J., Opdahl, A. L.,
Sindre, G.), Trondheim, Norway, 439-453.
Palmer, N., 2007. A Survey of Business Process Initia-
tives. In Business Process Trends Report,
www.BPTrends.com.
Recker, J., 2007. A Socio-Pragmatic Constructionist
Framework for Understanding Quality in Process
Modelling. In Australasian Journal of Information
Systems, 14 (2), 43-63.
Rosemann, M., 2006. Potential Pitfalls of Process Model-
ing: Part A. In Business Process Management Journal,
12 (2), 249-254.
Sapp, R. W., Crawford, D. M., Rebishcke, S. A., 1998.
Activity – Based Information for Financial Institu-
tions. In The Journal of Bank Cost & Management
Accounting. 3 (2), 53-62.
Scheer, A.-W., 2000. ARIS - Business Process Modeling,
Springer, Berlin, Germany, 3
rd
edition.
Seitz, N., Ellison, M., 2004. Capital budgeting and long-
term financing decisions. 3
rd
edition, Gale Group,
Farmington Hills, Michigan.
Shapiro, A. C., 2004. Capital budgeting and investment
analysis, Prentice Hall, Englewood Cliffs, New Jersey.
vom Brocke, J., 2007, Service Portfolio Measurement.
Evaluating Financial Performance of Service-Oriented
Business Processes. In: International Journal of Web
Services Research (IJWSR), 4 (2), S. 1-32.
vom Brocke, J., Lindner, M. A., 2004. Service portfolio
measurement: a framework for evaluating the financial
consequences of out-tasking decisions. In Proceedings
of the 2nd international conference on Service ori-
ented computing. New York, New York, 203-211.
TOWARDS A VALUE-ORIENTED APPROACH TO BUSINESS PROCESS MODELLING
385
