
ANALYSING MULTIDIMENSIONAL DATABASES USING DATA
MINING AND BUSINESS INTELLIGENCE TO PROVIDE
DECISION SUPPORT
Rajveer Singh Basra and Kevin J. Lu
Brunel Business School, Brunel University, Uxbridge, Middlesex, UB8 3PH, U.K.
Keywords: Business Intelligence (BI), decision support systems (DSS), data mining, multidimensional databases
(MDDB), data cubes, digital dashboard, reporting, on-line analytical processing (OLAP).
Abstract: After relational databases and data warehouses, the techniques used for data management have entered the
next phase, Business Intelligence Tools. These tools provide enhanced business functionality by integrating
data mining and advanced analytics into data warehouse systems to provide comprehensive support for the
purposes of data management, analysis and decision support. In this paper, we introduce an on-going project
aimed at developing BI tools on data warehouse systems for multi-dimensional analysis. A prototype has
been developed and has been tested for two examples, which are also reported in this paper.
1 INTRODUCTION
Reduced cost of storage equipment has facilitated
companies to store vast amounts of data. Typically,
key information is retained and knowledge extracted
enabling organisations to discover customer needs
and preferences, the competition, conditions in the
industry and general economic, technological, and
cultural trends. Furthermore, the explosion of the
internet and web based services, enables access to
previously untapped markets, consequently
companies are required to cope with ever increasing
quantities of information. Such information and data
is stored in data warehouses; data warehouses
facilitate an organisation to store and analyses their
data in order to utilise this it to make informed
decisions. The requirement for informed decisions
has lead to the development and growth of Business
intelligence (BI).
BI amalgamates tools such as reporting, data
depositories, on-line analysis tools and data mining,
in addition to providing access to data that has been
integrated and cleaned. Users are able to analyse,
manipulate, transform and combine data to assist
organisations to discover correlations, trends and
patterns aiding an organisation to become more
competitive allowing managers to make more
informed decisions (Simmers, 2004). Traditionally
the focus of BI has been on the analysis of batch
data that is updated periodically. Batch updating has
traditionally been daily, therefore real-time has been
considered anything better than that (Finnie et al,
2005). However with the internet facilitating a larger
quantity of transactions, and blurring the lines
between time zones, it is imperative that businesses
move toward a model that allows for true real-time
transactions and reach as many customers as
possible at the least possible cost, thus targeting
previous customers and current needs, but also
potential customers and forecast trends. Furthermore
with such a dynamic environment it is essential that
BI tools and information be provided to managers
enabling them to make informed decisions. Thus BI
forms a very well suited platform to be integrated
with Decision Support Systems (DSS).
Since its introduction in the 1970s, decision
makers in a number of fields have employed DSS to
aide in critical decisions (Arnott, 2007). DSS are an
interactive computer based system that is intended to
provide support to the decision makers engaged in
solving various semi- to ill-structured problems
involving multiple attributes, objectives and goals
(Nemati et al, 2002). Thus DSS can be defined as an
interactive computer-based system to aide decision
makers utilise data and models to identify problems,
solve problems and reach the most efficient
decision. DSS integrate both data and models to
assist the decision making processes (Rupnik et al,
2006). It should be noted however that DSS are not
autonomous systems and therefore is not intended to
replace decision-makers, but improve the
effectiveness of the decisions (Mladeni et al, 2002),
472
Singh Basra R. and J. Lu K. (2008).
ANALYSING MULTIDIMENSIONAL DATABASES USING DATA MINING AND BUSINESS INTELLIGENCE TO PROVIDE DECISION SUPPORT.
In Proceedings of the Tenth International Conference on Enterprise Information Systems - AIDSS, pages 472-479
DOI: 10.5220/0001695404720479
Copyright
c
SciTePress

however traditional DSS or conventional AI
techniques for supporting the decision-making
process, fail to address situations that require a vast
amount of data to be analysed from Databases,
especially multi-dimensional databases for effective
support to be provided.
The purpose of this paper is to describe how BI
techniques, especially data mining and digital
dashboards can aide decision makers, particularly
managers and those in a senior decision-making
position make informed decisions using large
quantities of data extracted from multidimensional
databases. It is the inability to analyse large
quantities of data from multidimensional databases
in an efficient manner that has hindered
conventional decision support systems and artificial
intelligence models. Yet, as processing and storage
capacity has increases, companies are storing vast
amounts of data within data warehouses. BI
techniques such as data mining provide the means to
interrogate large-scale data warehouses to extract
and analyse the data, providing the means through
which the decision making process can be
supported. Data mining is a core tool of BI models,
used effectively it can significantly aide
organisations to form critical decisions faster and
with an increased degree of confidence (
Mladenic´ et
al 2003). Several authors have discussed the
potential benefits that can be reaped from the
integration of data mining into DSS and they have
all confirmed the value of investigating this. (Rupnik
et al, 2006).
Furthermore this paper will purpose a
prototype system for the integration of BI techniques
and DSS to interrogate and analyse
multidimensional databases within a business
context to aide the decision-making process. As a BI
application, DSS would form an aspect of a program
that analyzes business data and presents it to
decision-makers with a view to assisting in the
decision-making process. As opposed to an
operational application, which collects data over the
normal course of business, BI is an informational
application, thus it gathers data like comparative and
projected figures. This will enable comparisons to be
made between products, trends to be discovered and
facilitate predictive capabilities to be exploited to
aide the decision-maker; furthermore these
discoveries can be presented to the user via digital
dashboards resulting in an informative user friendly
interface. The integration of BI techniques and DSS
can lead to the improved performance of an
organisation and enable the system to be
investigated for problems that have not been
addressed before by enabling the fusion of
knowledge from experts and knowledge extracted
from data (Mladeni et al, 2002). Being able to apply
this technology to analyse multidimensional
databases (MDDB) will be a great asset to
organisations.
The remainder of this paper is organised into
the following sections; Section 2 will examine some
of the currently available BI tools that can be
investigated to facilitate DSS based upon BI
techniques and model. For the purpose of this
research the open-source data mining tool Weka has
been investigated and customised. In Section 3,
research that has been conducted using datasets from
the UCI machine learning repository, in addition to
data sets that have been collected from a large retail
company will be discussed. These dataset have been
interrogated using a customised BI platform yielding
promising results for the application of BI
techniques to interrogate MDDB with a view to
providing decision support. In Section 4, a summary
of the preliminary research and a road map for future
work will be presented.
2 BACKGROUND
It has been identified that the Information/Data
management systems market advances in 20-year
cycles. The initial period can be identified from the
1950s. During this period in a seminal October 1958
IBM Journal article (Luhn, 1958) that the term
“Business Intelligence” was first coined. At this time
organisations collected data from non-automated
sources, yet lacked the computing resources to
properly analyze the data, thus, companies often
made decisions primarily on the basis of intuition.
During the 1970s to 1990s the data management
sector dominated by companies such as SAS, IBI,
and IBM, was characterised by production reporting
on mainframes. This eventually evolved to the
current “modern era of Business Intelligence.”
The modern era of BI can be characterized by
user friendly client/server-based BI tools. This
period has also witnessed the evolution of query
reporting, and OLAP technology being migrated
from client/server to Web-based architecture and the
development of broad suites of BI tools from
vendors such as Business Objects, Cognos, and
Hyperion (Lawton, 2006).
BI software incorporates the ability to mine
data, analyze, and report. Some modern BI software
allows users to cross-analyze and perform deep data
research rapidly. In modern applications of BI
software, managers are able to quickly compile
reports from data, for forecasting, analysis, and
ANALYSING MULTIDIMENSIONAL DATABASES USING DATA MINING AND BUSINESS INTELLIGENCE TO
PROVIDE DECISION SUPPORT
473
business decision-making (Zhang et al, 2007).
Consequently, modern BI models can be classed
under two categories: End user query, reporting,
and analysis (QRA) and advanced analytics:
• End-user query, reporting, and analysis include
ad hoc query and multidimensional analysis tools
as well as dashboards and production reporting
tools. Query and reporting tools are designed
specifically to support ad hoc data access and
report building by either IT or business users.
Multidimensional analysis tools include both on-
line analytical processing (OLAP) servers and
client-side analysis tools that provide a data
management environment used for modelling
business problems and analyzing business data.
• Advanced analytics software includes data
mining and statistical software (previously called
technical data analysis). It uses technologies such
as neural networks, rule induction, and
clustering, among others, to discover
relationships in data and make predictions that
are hidden, not apparent, or too complex to be
extracted using query, reporting, and
multidimensional analysis software.
These BI models are being implemented in a
number of industries, for a variety of purposes,
which has led to the development of many BI tools.
However, in the past BI tools where prohibitive due
to their complex nature requiring a specialist
operator, this is changing and in the face of
increased demand. BI developers have endeavoured
to make their tools more user-friendly and ensure
that they are able to integrate more seamlessly with
the current applications (Ortiz, 2002). Furthermore
there are a number of open-source BI tools that are
available, since the interest has not been solely from
commercial vendors but also from researchers. The
requirement for user-friendly BI applications has
resulted in tools that can be classified into one of 4
categories, depending upon the required results:
Business operations reporting: Organisations
often require weekly or monthly reports. These
reports generate aggregated views of data to
enable stakeholders and management to view
the state of their business such as the value of
assets, and distinguish between the assets which
are obtaining their goals to the resources that are
performing sub-optimally.
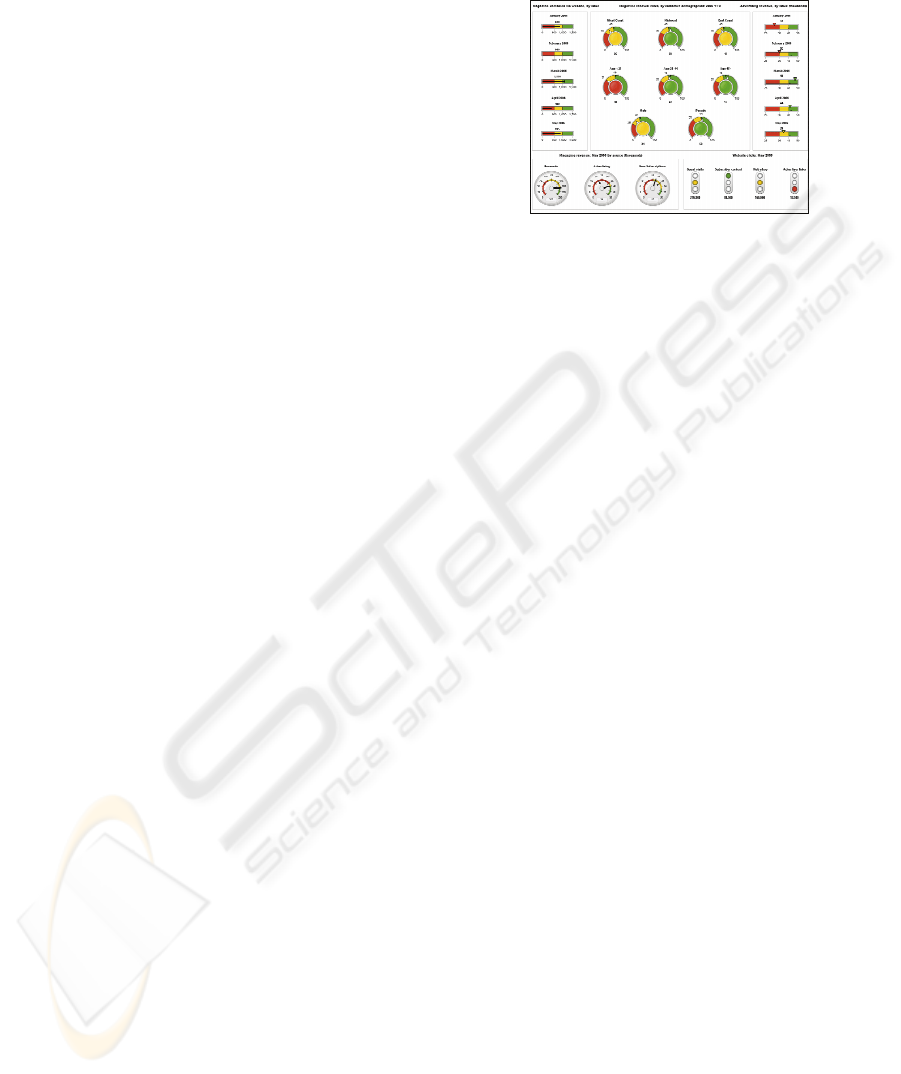
Digital Dashboard: Is a business management
tool utilised to visually ascertain the status and
performance of a business enterprise via key
business indicators. Digital dashboards use
visual, at-a-glance displays of data pulled from
disparate business systems to provide warnings,
action notices, next steps, and summaries of
business conditions. An example of a digital
dashboard by SAS Dashboards can be seen in
Figure 1.
Figure 1: SAS digital dashboard.
Multidimensional Analysis: In Relational data,
each piece of data correlates to one row and one
column, each of which can be considered a
dimension, thus relational data is considered to
be two-dimensional. Multi-dimensional
databases however provide a higher-level
perspective of the data by providing further
dimensions to include core components of your
business plan such as Accounts; Time;
Products; and markets. Each dimension consists
of individual components known as members.
Although the Dimension will tend to remain
static, members will generally be dynamic, e.g.
new customers or products added. Multi-
dimensional analysis supports interactive
examination of large amounts of data from
many perspectives facilitating for the
interrogation of data at a high-level, however
this traditionally requires a reliable data
warehousing / data mart backend Pederson &
Jenson, 2001). If the data is configured correctly
the data can quickly provide answers to
analytical queries using OLAP.
Data mining: Data mining is concerned with
finding models and patterns from the available
data (Mladenic´ et al, 2003). This can be
achieved through the extraction of data from a
database by utilising software that can isolate
and identify previously unknown patterns or
trends in large amounts of data (Han et al,
2006). There are a variety of data mining
techniques that reveal different types of patterns
such as, predictive data mining algorithms,
descriptive data mining algorithms and neural
networks as very advanced means of analysing
data (Lavrac, 2006).
The predictive capabilities of a BI tool can be
further enhanced by integrating data mining with
other BI strategies such as Customer Relationship
Management (CRM) a BI tool can make effective
ICEIS 2008 - International Conference on Enterprise Information Systems
474

predictions and forecasts for a manager. Being one
of the leading business strategies CRM integrates
sales, marketing and service across multiple business
units and customer contact points. In addition to this
CRM helps companies understand the value of
customers, identify and target their most profitable
customers, encourage and maintain high-quality
relationships that increase loyalty and profits (Lee &
Park, 2005). However for this to be successful it is
imperative that customer profitability precisely
evaluated thus, targeting the most profitable
customers, consequently, companies will utilise
historical data and through ETL (Extract, Transform
and Load) and data mining techniques, to
extrapolate this data in order to (as accurately as
possible) predict trends and forecast expected
growths within their business operations. This
enables organisations to make focused decisions for
the future. Forecasting can also be utilised to find
correlations between various products, thus for
example would increased consumption of one
product affect the performance of another? Thus BI
can be utilised to view not only current action, but
also suggest the most suitable direction an
organisation should take, consequently BI can be an
invaluable tool for decision –makers and managers.
Increasing standards, automation, and
technologies have led to vast amounts of data
becoming available. Data warehouse technologies
have facilitated the establishment of repositories to
store this data. Improved ETL and even recently
Enterprise Application Integration tools have
increased the speed of collecting the data. OLAP
reporting technologies enable faster generation of
new reports which analyze the data. However
conventional DSS even those based upon AI models
and conventional BI tools have failed to integrate
effectively when dealing with large datasets.
Considering the capabilities of both Data mining and
DSS, the two approaches can be integrated to better
solve data analysis and decision-making. In
knowledge management (
Mladenic´ et al, 2003), such
integration is interesting for several reasons. For
example, in data mining it is often unclear which
algorithm is best suited for the problem. This
decision support process could be extended to the
initial phase of data collection, thus when data is
collected decisions models could be developed to
describe the data and ensure that the correct data is
collected, thereby improving the quality of results
when data is analysed, furthermore this data could
be presented via a digital dashboard. These are two
examples of how data mining and DSS can be
integrated to improve the quality of BI systems
(Mladenic´ et al, 2003), it would be of even greater
significance if such models, could de developed to
handle extremely large datasets, with the results
provided via visual BI models to support decision
making. If the integration of these two technologies
is to be truly beneficial, they must address the issue
of accessing and analysing the vast stores of data
that companies are collecting.
Traditional methods of storing and viewing data
are databases and spreadsheets. The traditional
methods provide adequate support for a small
volume of data that has few non-hierarchical
dimensions. They do not however support the
requirements for advanced data analysis. Despite
spreadsheets being a staple tool for many business
practices for a number of years, as the quantity of
data an organisation stores increases it has become
apparent that spreadsheets are an inadequate tool for
managing and storing multidimensional data since
they fail to separate the structural information from
the desired views of the information. A spreadsheet
is a useful tool for analyzing sales data such as
product sold, number of purchases, and city of sale.
The model of the spreadsheet has been further
extended to a two-dimensional spreadsheet with
associated subtotals and totals known as a pivot
table. However, adding a third dimension such as
time or classifying the data into higher-level product
types requires a considerably more complex setup
(Pederson and Jensen, 2001). The only effective
solution is to use database technology that offers
inherent support for the full range of
multidimensional data modelling, as
multidimensional structures will enable managers to
“slice and dice” views of company performance data
and drill down into trouble spots (Hasan and Hyland,
2001).
Multidimensional databases (MDDB) developers
and users consider the dimensional view of
organizational data to provide managers with a
means of understanding the current state and future
possibilities of their business. MDDB view data as
cubes (multidimensional arrays) that are capable of
categorising spreadsheets to any number of
dimensions. Thus, a collection of related data cubes
comprises a multidimensional database (Pederson &
Jensen, 2001). In data cubes each core data value
(key performance indicators) occupies a cell indexed
by a unique set of dimension values supporting
hierarchies in dimensions and formulas without
duplicating their definitions. In its simplest form a
data cube can be visualised as a structure using a
value, such as number of products sold, and show
how it varies along the three most common
dimensions (time, location, and product type)
(Hasan and Hyland, 2001).
ANALYSING MULTIDIMENSIONAL DATABASES USING DATA MINING AND BUSINESS INTELLIGENCE TO
PROVIDE DECISION SUPPORT
475
Storing data in MDDB may result in a robust
view of the data; for this technology to be fully
exploited it is essential that the data can be accessed
and analysed in a timely and efficient manner.
OLAP provides a proficient method to access a data
warehouse for multidimensional analysis and
decision support. However OLAP techniques alone
cannot derive patterns from the stored data (Fong et
al, 2002). For this purposes the investigation of data
mining and BI tools which analysts can exploit to
interrogate data cubes, is thus a natural partner to
OLAP and MDDB and necessary if the technology
is to reach its full potential.
3 BI PROSPECTOR ENGINE
As discussed in the previous section, managers view
information systems as an essential part of the
successful, modern business. Similarly the
increasing popularity of data warehousing illustrates
that many managers now see the huge volumes of
data stored in organizational databases as a company
asset. Used effectively, this data provides
information for management decision making and
strategic planning (Hasan & Hyland, 2001). This has
motivated the investigation of a system that will
address the issue of using data mining and BI
techniques, for analysing MDDB to provide decision
support.
For the purpose of this research, a prototype
system has been developed. Integrating the Weka
machine learning workbench, the Prospector Engine
aims to apply data mining algorithms to analyse
MDDB to provide decision support.
The Prospector engine, will provide a graphical
means through which MDDB can be interrogated to
find trends and correlations providing support to
decision makers, the Prospector Engine, integrates
the functions of Weka such as providing a
collection of visualization tools and algorithms for
data analysis and predictive modelling (Witten &
Frank, 2005), however the Prospector engine will
extend this facility to interrogate MDDB and present
the data via digital dashboards.
The initial phase of this research investigated
various data mining algorithms, for this purpose a
dataset from the UCI machine learning site was
manipulated. The German Bank Credit data,
contains details of customers and there history, thus
this dataset classifies 1000 instances (people /
customers) described by a set of 30 attributes as
good or bad credit risks. Thus, each applicant was
rated as “good credit” (700 cases) or “bad credit”
(300 cases). New applicants for credit can also be
evaluated on these 30 "predictor" variables. The data
set has been investigated with a view to discovering
eligible loan applicants and potential credit risks.
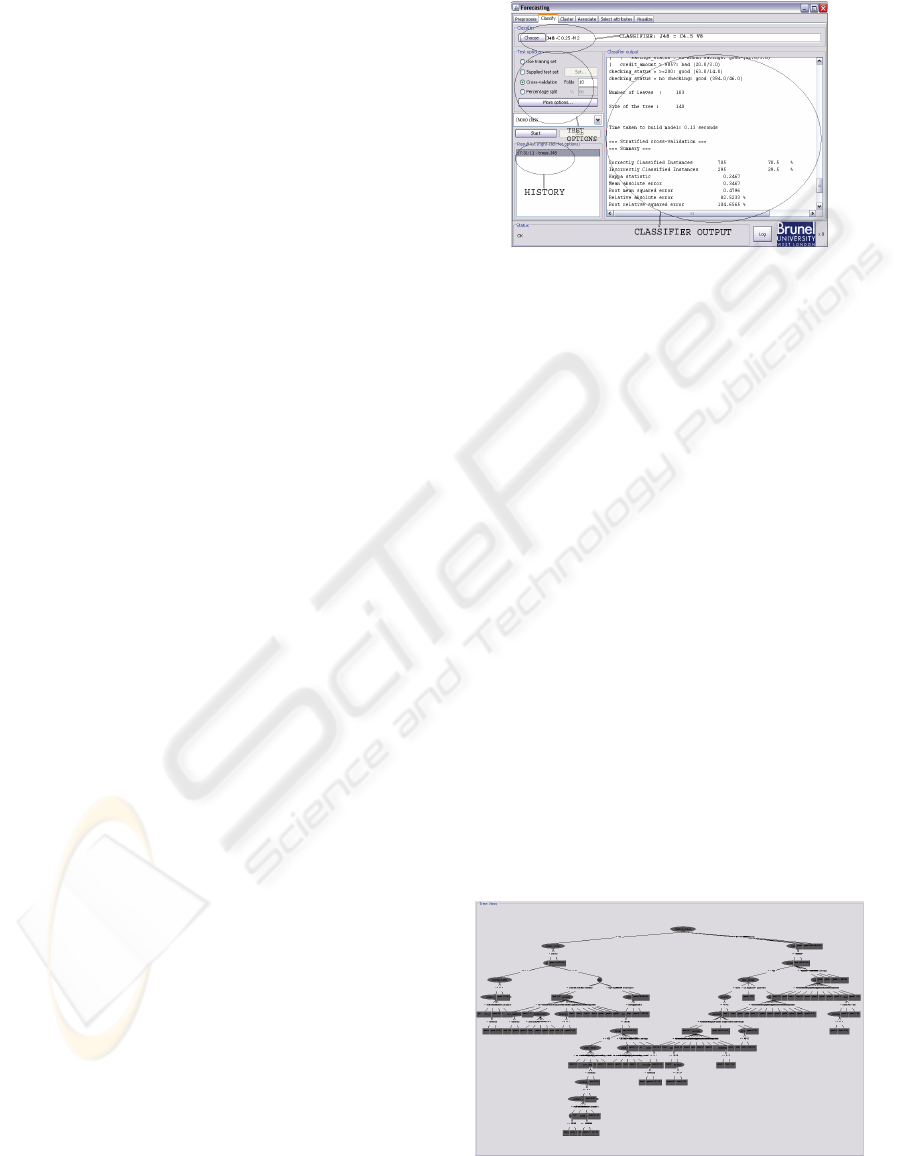
Figure 2: C4.5 algorithm applied to the German credit
dataset
.
One of the data mining algorithms applied to a
data set for investigation was the C4.5 version 8
algorithm. C4.5 Version 8 is an algorithm used to
generate a decision tree developed by Ross Quinlan
(see Figure 2). C4.5 is an extension of Quinlan's
earlier ID3 algorithm. The decision trees generated
by C4.5 can be used for classification, and for this
reason, C4.5 is often referred to as a statistical
classifier. C4.5 addresses the following issues not
dealt with by ID3:
• Avoiding over fitting the data. Determining how
deeply to grow a decision tree.
• Reduced error pruning.
• Rule post-pruning.
• Handling continuous attributes e.g., temperature
• Choosing an appropriate attribute selection
measure.
• Handling training data with missing attribute
values.
• Handling attributes with differing costs.
• Improving computational efficiency.
Once the algorithm was applied a pruned decision
tree for the German Credit data can be produced (see
figure. 3).
Figure 3: Pruned C4.5 decision tree.
ICEIS 2008 - International Conference on Enterprise Information Systems
476

Upon applying the algorithm to the data set as in
figure 2, a results output is produced consisting of a
text decision tree and a number of statistics. The
output can be scrutinized (see table 1) to analyse the
significance of these results. Lines 28-169 are a text
based version of the decision tree constructed by the
C4.5 classifier depicted in Fig 3. This indicates how
the classifier uses the attributes to make a decision.
The leaf nodes indicate which class an instance will
be assigned to should that node be reached. The
numbers in brackets after the leaf nodes indicate the
numbers of instances assigned to that node, followed
by how many of those instances were incorrectly
classified as a result. With other classifiers some
other output will be given that indicates how the
decisions are made, e.g. a rule set, it should be noted
that this tree has been pruned to remove branches
that do not help by replacing them with leaf nodes.
Lines 173-181 indicate the level of the error
levels during a 10-fold cross-validation. The
correctly/incorrectly classified instance refers to the
case where the instances are used as test data and are
the most important statistics here.
Lines 182-185 show the True Positive (TP) rate
is the proportion of examples which were classified
as class x, among all examples which truly have
class x, i.e. how much part of the class was captured.
It is equivalent to Recall. In the confusion matrix,
this is the diagonal element divided by the sum over
the relevant row, i.e. 588/(588+112)=0.84 for class
yes and 117/(183+117)=0.39 for class no in our
example. The False Positive (FP) rate is the
proportion of examples which were classified as
class x, but belong to a different class, among all
examples which are not of class x. In the matrix, this
is the column sum of class x minus the diagonal
element, divided by the rows sums of all other
classes; i.e. 183/(183+117)=0.61 for class yes and
112/(588+112)=0.16 for class no. The Precision is
the proportion of the examples which truly have
class x among all those which were classified as
class x. In the matrix, this is the diagonal element
divided by the sum over the relevant column, i.e.
588/(588+183)=0.763 for class yes and
117/(112+117)=0.511 for class no. The F-Measure
is simply 2*Precision*Recall/ (Precision+Recall).
From line 186-189 is the confusion matrix
for the 10-fold cross-validation, showing what
classification the instances from each class received
when it was used as testing data. E.g. for class "a"
588 instances were correctly classified and 112
instances were assigned to class "b".
Table 1: The output produced by applying C4.5 algorithm
to German credit data set.
1
2
3
4
5
6
7
…
25
26
27
28
29
30
31
32
33
…
165
166
167
168
169
170
171
172
173
174
175
176
178
179
180
181
182
183
184
185
186
187
188
189
C4.5
Relation: german_credit
Instances: 1000
Attributes: 21
checking_status
duration
credit_history
…
class
Test mode: 10-fold cross-validation
=== Classifier model (full training set) ===
C4.5 pruned tree
------------------
checking_status = <0
| foreign_worker = yes
| | duration <= 11
| | | existing_credits <= 1
…
| credit_amount > 9857: bad (20.0/3.0)
checking_status = >=200: good (63.0/14.0)
checking_status = no checking: good (394.0/46.0)
Number of Leaves : 103
Size of the tree : 140
Time taken to build model: 0.19 seconds
=== Stratified cross-validation ===
=== Summary ===
Correctly Classified Instances 705 70.5
%
Incorrectly Classified Instances 295 29.5
%
Kappa statistic 0.2467
Mean absolute error 0.3467
Root mean squared error 0.4796
Relative absolute error 82.5233 %
Root relative squared error 104.6565 %
Total Number of Instances 1000
=== Detailed Accuracy By Class ===
TP Rate FP Rate Precision Recall F-Measure ROC Area Class
0.84 0.61 0.763 0.84 0.799 0.639
good
0.39 0.16 0.511 0.39 0.442 0.639
bad
=== Confusion Matrix ===
a b <-- classified as
588 112 | a = good
183 117 | b = bad
Examples of some other algorithms that could
be applied to this data set are, Naïve Bayes and
Bayes net classifiers:
Naïve Bayes:
a simple probabilistic classifier based
on applying Bayes' theorem with strong (naive)
independence assumptions. A more descriptive term
for the underlying probability model would be
"independent feature model". In spite of their naive
design and apparently over-simplified assumptions,
naive Bayes classifiers often work much better in
many complex real-world situations than one might
expect.
⇒ Via the Naïve Bayes classifier each attribute will
be treated independently, thus the probability
that the customer represents a ‘good’ or ‘bad’
ANALYSING MULTIDIMENSIONAL DATABASES USING DATA MINING AND BUSINESS INTELLIGENCE TO
PROVIDE DECISION SUPPORT
477

credit risk will be calculated from independent
probabilities, therefore since independent
variables are assumed, only the variances of the
variables for each class need to be determined
and not the entire covariance matrix.
Bayes Net: A base class for a Bayes Network
classifier. A Bayesian network (or a belief network)
is a probabilistic graphical model that represents a
set of variables and their probabilistic
independencies. For example, a Bayesian network
can be used to calculate the probability of a patient
having a specific disease, given the absence or
presence of certain symptoms, if the probabilistic
independencies between symptoms and disease as
encoded by the graph hold.
⇒ The Bayes Net classifier can be investigated to
draw a network of nodes, one for each attribute,
connected by directed edges thus to eliminate
cycles (creating directed acyclic graph). Each
node of the Bayesian network will define a
probability distribution that is used to predict
the class probability, thus combining features
from decision trees and rules to predict the
probability of the credit risk.
Once the investigation of data mining algorithms
was completed, datasets were collected from a large
retail company, which due to confidentiality cannot
be disclosed, however for the purpose of the paper
will be referred to as “Company S”. This data
consists of financial, records, product details, and
supplier details. The data set spans from 2002- 2007,
with details of over 40 suppliers and over 5000
different products, in addition to this data there are
details of information relating to the financial state
of the company.
A random sample of 1000 products was
selected against there sales figures over the 5 years
and this data was converted to an ARFF file. An
ARFF (Attribute-Relation File Format) file is an
ASCII text file that describes a list of instances
sharing a set of attributes. First developed by the
Machine Learning Project at the Department of
Computer Science of The University of Waikato for
use with the Weka machine learning software,
ARFF files provide an effective method for
encapsulating the data for machine learning (Witten
& Frank, 2005).
Once converted machine learning algorithms
were applied to the data set, these algorithms yielded
results in a similar fashion to those of the German
Credit, for the results of the data for Company S, a
ROC curve was produced. A ROC curve of these
results can be produced (see figure 4). The ROC
curve represented by plotting the fraction of true
positives (TPR = true positive rate) vs. the fraction
of false positives (FPR = false positive rate). The
area under the ROC curve can be interpreted as the
probability that in the event a random positive and
random negative is selected, the classifier will assign
a higher score to the positive example than to the
negative. The ROC curve enables the performance
and accuracy of the classifier to be evaluated
allowing for the selection of the most suitable
models.
Figure 4: ROC Curve.
4 SUMMARY AND FUTURE
DIRECTION
In this paper it has been investigated how BI can be
applied for decision-making. BI and BI tools
combine a number of disciplines with a view to
enhancing business practices by analysing corporate
data. Decision support systems conventionally
encompass the knowledge of experts and advise
users upon the most suitable actions. These two
systems provide great scope for integration, as the
facility to suggest courses of action can draw upon
corporate data and previous experiences can be
analysed to predict the most likely outcome, for see
trends and target consumer groups. Given the
increasing amount of data that is being stored, and
the increasing necessity to make efficient use of this
data, being able to apply BI techniques to a MDDB,
in order to interrogate the data and provide decision
support is very promising.
In this paper this potential was investigated
using the BI prospector engine through this many
functions key to which is the availability of a
number of data-mining algorithms, was applied to
interrogate datasets in section 3. However, to further
this research the dataset provided by Company S
will be interrogated directly from a MDDB, with the
output analysed through digital dashboards and
reports. Facilitating for the BI prospector engine to
be able to effectively advise decision-makers
utilising previous experiences and trends to
ICEIS 2008 - International Conference on Enterprise Information Systems
478

extrapolate data for accurate predictions that can
support the decision making process. This is of great
interest as data mining will facilitate a greater level
of accuracy due to its natural ability to find trends of
significance in arbitrary data. Furthermore the
reporting feature (which forms an aspect of the
visualisation aspect of BI) will require that the
trends, patterns and information discovered by the
platform be presented to the user in a manner that is
easy to use and analyse, enabling the information to
be efficiently utilised and support organisations with
decisions regarding operations and future direction
with reports that can be easily understood by any
employee, not just experts.
The reporting feature will also lend itself to
Data profiling, as these reports will enable the BI
prospector engine to collect statistics and
information about data in order to:
1. Find out whether existing data can easily be
used for other purposes.
2. Provide metrics upon data quality including
whether the data conforms to company
standards.
3. Assess the risk involved in integrating data for
new applications, including the challenges of
joins.
4. Track data quality.
5. Assess whether metadata accurately describes
the actual values in the source database.
6. Understanding data challenges early in any data
intensive project, so that late project surprises
are avoided. Finding data problems late in the
project can incur time delays and project cost
overruns.
7. Encompass an enterprise view of all data, for
uses such as Master Data Management where
key data is needed, or Data governance for
improving data quality.
Consequently, the Reporting facility will enable
platform to take snapshots of the data and statistics
be it from profiling or forecasting/prediction to
provide managers with details and performance
indicators upon which decisions can be made.
REFERENCES
Arnott, D., Pervan, G., 2007. Eight key issues for the
decision support systems discipline. In Decision
Support Systems. Available online 1 October 2007
http://www.sciencedirect.com
Finnie, G.; Barker, J., (2005) Real-time business
intelligence in multi-agent adaptive supply networks.
In e-Technology, e-Commerce and e-Service, 2005.
EEE '05. Proceedings. The 2005 IEEE International
Conference on 29 March-1 April 2005 Page(s):218 –
221
Fong, A.C.M., Hui, S.C., Jha, G., 2002. Data mining for
decision support. In IT Professional, Volume 4, Issue
2, March-April 2002 Page(s):9 – 17. IEEE Xplore.
Han J, Kamber M. 2006. Data mining: concepts and
techniques. Morgan Kaufman. Los Altos, CA, 2
nd
edition.
Hasan, H., Hyland, P., 2001. Using OLAP and
multidimensional data for decision making. In IT
Professional Volume 3, Issue 5, Sept.-Oct. 2001
Page(s):44 – 50. IEEE Xplore
Lawton, G. 2006. Making Business Intelligence More
Useful. In Computer Volume 39, Issue 9, Sept. 2006
Page(s):14 – 16. IEEE Xplore.
Lee, J. H & Park, S. C., 2005. Intelligent profitable
customers segmentation system based on business
intelligence tools. Expert Systems with
Applications, Volume 29, Issue 1, July 2005, Pages
145-152. Elsevier Science.
Luhn, H. P., 1958. A Business Intelligence System. In
IBM Journal vol. 2, no. 4, p.314. IBM Available
online: http://www.research.ibm.com/journal/
Mladenic´ D, Lavracˇ N, Bohanec M, Moyle S., 2003.
Data mining and decision support: integration and
collaboration. Kluwer Academic Publishers.
Dordrecht.
Nemati, H. R., Steiger, D. M., Iyer, S. L. Herschel, R. T.,
2002. Knowledge warehouse: an architectural
integration of knowledge management, decision
support, artificial intelligence and data warehousing.
In Decision Support Systems, Volume 33, Issue 2, June
2002, Pages 143-161. Elsevier Science.
Pedersen, T.B., Jensen, C.S., 2001. Multidimensional
database technology. In Computer, Volume 34, Issue
12, Dec. 2001 Page(s):40 - 46. IEEE Xplore
Rupnik, R., Kukar, M., Bajec, M., Krisper, M., 2006.
DMDSS: data mining based decision support system
to integrate data mining and decision support
In Information Technology Interfaces, 2006. 28th
International Conference on
2006 Page(s):225 – 230.
Simmers, C., 2004. A stakeholder model of business
intelligence. In Proceedings of the 37th Annual
Hawaii International Conference on
5-8 Jan. 2004
UCI Machine learning Repository, Available online:
www.ics.uci.edu/~mlearn/MLRepository.html
Weka Project home page at University of Waikato in New
Zealand. Available online:
http://www.cs.waikato.ac.nz/ml/weka/
Witten, I., Frank E., 2005. Data Mining: Practical
machine learning tools and techniques. Morgan
Kaufmann, San Francisco. 2
nd
Edition
Zhang, F., Yang, B., Song, W., Li, L., 2007.
Intelligent Decision Support System Based on Data
Mining: Foreign Trading Case Study
Control and Automation. In IEEE International
Conference on
May 30 2007-June 1 2007 Page(s):1487 - 1491 ICCA
2007.
ANALYSING MULTIDIMENSIONAL DATABASES USING DATA MINING AND BUSINESS INTELLIGENCE TO
PROVIDE DECISION SUPPORT
479
