
WEBSITE SERVICE QUALITY IN IRELAND
A Consumer Perspective
Regina Connolly
Dublin City University, Glasnevin, Dublin 9, Ireland
Keywords: eService Quality, small-to-medium enterprises, E-S-QUAL.
Abstract: Despite the fact that service quality is a critical determinant of website success, studies show that consumers
frequently view the service quality delivered through websites as unsatisfactory. This paper outlines a study
that is investigated the dimensions of website service excellence valued by Irish customers of a small to
medium enterprise specialising in gifts. The e-S-QUAL measurement instrument was applied to the
customers who purchase products online from this retailer, in order to determine their purchasing patterns
and the dimensions of e-service quality that they value. This study makes a major contribution to the
literature as it describes the application of the newly operationalised E-S-QUAL measurement instrument.
The results of this study will indicate the effectiveness of the instrument in determining gaps in e-service
quality. The findings will benefit both practitioners and researchers in developing an understanding of the
factors that contribute towards the creation and maintenance of consumer satisfaction in Irish online
transactions.
1 INTRODUCTION
In Ireland the need for online vendors to understand
the dimensions of e-service quality that customers
value has an added impetus as Irish consumers
continue to resist transacting via the Internet – using
it as an information rather than a transaction medium
and thus limiting its commercial potential. For
example, by the end of 2002, nearly half of the Irish
population had Internet access, but only 38% of Irish
Internet users had made an online purchase
(Amarach Consulting, 2002). Studies in the UK
have also found that the percentage of the Internet
population who shop online has not increased in line
with Internet penetration. Thus, while increases in
the sheer size of the Internet population mean that
more people have made an online purchase, the
proportion of Internet buyers is not increasing.
Therefore, in order that the commercial potential of
the Internet is to be realized - a potential that is
expanding dramatically as a result of advances in
consumer wireless technologies and their
transaction-facilitating capabilities – understanding
the dimensions of service quality that Irish online
consumers value is of critical importance.
1.1 Research Objectives
This research extends our understanding of service
quality within the setting of online retailing. The
study has two objectives. Firstly, it examines the
dimensions of website service quality that are valued
by customers of a small to medium online company
in Ireland. Secondly, by applying the newly
operationalised e-S-QUAL measurement instrument,
it explores the relevance of this instrument in the
evaluation of business to consumer website service
quality.
2 SERVICE QUALITY
Service quality in is one of the most researched
topics in the area of service marketing. Although
research into the dimensions of website service
quality that are valued by online consumers is in an
embryonic stage, it is an issue of considerable
importance. In part, this is due to the fact that as
competition for online consumers intensifies, service
quality has become a key differentiator for online
vendors and thus it has become increasingly
important to have an appropriate means by which to
measure it. This is particularly true in the business
378
Connolly R. (2008).
WEBSITE SERVICE QUALITY IN IRELAND - A Consumer Perspective.
In Proceedings of the Fourth International Conference on Web Information Systems and Technologies, pages 378-386
DOI: 10.5220/0001519003780386
Copyright
c
SciTePress

to consumer electronic commerce marketplace
where web vendors compete for a limited number of
consumers and where consumer loyalty has become
a key indicator of success.
Service quality has been defined as the
difference between customers’ expectations for
service performance prior to the service encounter
and their perceptions of the service received
(Asubonteng et al., 1996). When performance does
not meet expectations, quality is judged as low and
when performance exceeds expectations, the
evaluation of quality increases. Thus, in any
evaluation of service quality, customers’
expectations are key to that evaluation. Moreover,
Asubonteng et al., (1996) suggest that as service
quality increases, satisfaction with the service and
intentions to reuse the service increase.
Meeting customer service requirements is both a
performance issue (whether the service satisfies the
customers requirements) and an issue of conformity
to measurable standards. For example, for Swartz
and Brown (1989) distinguish between the
consumer’s post-performance evaluation of ‘what’
the service delivers and the consumer’s evaluation of
the service during delivery. The former evaluation
has been termed ‘outcome quality’ (Parasuraman et
al., 1985), ‘technical quality’ (Gronröos (1983) and
‘physical quality’ (Lehtinen and Lehtinen, 1982).
The latter evaluation has been termed ‘process
quality’ by Parasuraman et al., (1985), ‘functional
quality’ by Gronröos (1983) and ‘interaction quality’
by Lehtinen and Lehtinen (1982).
The most frequently cited measure of service
quality is SERVQUAL, an instrument developed by
Parasuraman et al., (1985; 1988). It has been widely
cited in the literature and has been used to measure
service quality in a variety of settings e.g. health
care (Babakus and Mangold, 1992; Bebko and Garg,
1995, Bowers et al., 1994), large retail chains (Teas,
1993; Finn and Lamb 1991), fast food restaurants
(Cronin and Taylor 1992), a dental clinic, a tyre
store and a hospital (Carman 1990). Designed to
measure service quality from a customer
perspective, it consists of five basic dimensions that
represent the service attributes that consumers use to
evaluate service quality. The five dimensions are
tangibles, reliability, responsiveness, assurance and
empathy. In their model, Parasuraman et al., (1985;
1988) suggest that it is the gap between consumer
expectations with actual service performance that
informs service quality perceptions. To the degree
that service performance exceeds expectations, the
consumer’s perception of service quality increases.
To the degree that performance decreases relative to
expectations, the consumer’s perception of service
quality decreases. Thus, it is this performance-to-
expectations gap that forms the theoretical basis of
SERVQUAL. However, Parasuraman et al., also
note that the evaluation of service quality is not
based solely on the service outcome but also
involves evaluations of the process of service
delivery.
Despite its popularity, a number of issues related
to the use of SERVQUAL remain contentious, such
as the proposed causal link between service quality
and satisfaction (eg Woodside et al., 1989; Bitner
1990), and the question as to whether one scale can
be universally applicable in measuring service
quality regardless of the industry or environment
(Asubonteng et al., 1996; Cronin and Taylor 1992;
1994; Teas, 1993; Carman, 1990; Finn and Lamb,
1991). Moreover, although it remains the dominant
model for both researchers and managers, its
proposed universality and applicability is made even
more questionable by viewing the numerous
modifications that are evident in many studies that
purport to use this model (Paulin and Perrien, 1996).
2.1 e-Service Quality
Website service quality, frequently termed e-service
quality, has been defined as “consumers overall
evaluation and judgement of the excellence and
quality of e-service offerings in the virtual
marketplace (Santos, 2003) and “as the extent to
which a website facilitates efficient and effective
shopping, purchasing and delivery” (Zeithaml 2002).
E-service quality is constantly evolving due to the
pace of competition and the ease of duplicating
service features in the online world (Trabold et al.,
2006). Notwithstanding evidence of continuing
consumer dissatisfaction with service delivered
through the Internet (Gaudin 2003; Ahmad 2002)
studies of e-service quality remain limited and
frequently employ instruments that were developed
for use in a traditional environment such as the
SERVQUAL survey instrument. For example,
researchers (Van Iwaarden et al., 2004) have used
SERVQUAL to examine the quality factors
perceived as important in relation to the use of
websites, despite the fact that it was not designed to
measure perceived service quality in an online
environment and its applicability is therefore
unlikely to extend to that context. While it is true
WEBSITE SERVICE QUALITY IN IRELAND - A Consumer Perspective
379

that past conceptualisations can be useful platforms
for describing e-services (Van Riel, 2001), there is
an increasing awareness (Cai and Jun, 2003; Lie et
al., 2003) that the SERVQUAL instrument is limited
in terms of its ability to measure e-service quality
particularly as there are dimensions of service
quality unique to the electronic context. For
example, Cox and Dale (2001) argue that
dimensions of service quality specific to a traditional
environment such as competence, courtesy,
cleanliness, comfort, and friendliness, are not salient
in the electronic retail environment while such
dimensions as accessibility, communication,
credibility, and appearance, are of critical
importance in an on-line environment. Support for
inclusion of specific dimensions unique to the on-
line retail environment is also provided by Long and
McMellon (2004) who argue that factors such as
geographic distance and face-less ness of the
experience form part of the online service
experience and therefore should be part of any e-
service quality measurement instrument.
However, although several researchers have
proposed scales to evaluate websites, many of these
scales do not provide a comprehensive evaluation of
the service quality of the website. For example, the
focus of the WebQual scale (Loiacono et al., 2000)
is to provide website designers with information
regarding the website (e.g. informational fit to task)
rather than to provide specific service quality
measures from a customer perspective. Other scales
such as WebQual (Barnes and Vidgen, 2002)
provide a transaction-specific assessment rather than
a detailed service quality assessment of a website.
The SITEQUAL (Yoo and Donthu, 2001) scale
excludes dimensions central to the evaluation of
website service quality as does Szymanski and
Hise’s (2000) study, while researchers (Parasuraman
et al, 2005) have expressed caution regarding the
consistency and appropriateness of dimensions used
in the eTailQ scale proposed by Wolfinbarger and
Gilly (2003).
Recently however, many of these concerns have
been addressed by the original authors of the
SERVQUAL instrument through the development
and operationalisation of a multi-item scale for
examining website service quality (Parasuraman,
Zeithaml and Malhotra, 2005). This scale, termed
E-S-QUAL, is a four-dimensional, 22-item scale that
captures the critical dimensions of service quality
outlined in the extant literature. The dimensions are
efficiency, fulfilment, system availability, and
privacy. The scale has an accompanying subscale
called E-RecS-Qual which contains items focused
on handling service problems and is relevant to
customers who have had non-routine recovery
service encounters with the website. E-RecS-Qual
consists of a three-dimensional, 11 item scale.
These three dimensions comprise responsiveness,
compensation, and contact. Both scales, whose
specific purpose is the measurement of website
service quality, have been subjected to reliability
and validity tests and demonstrate good
psychometric properties.
As E-S-QUAL is a relatively new measure it has
therefore not been used extensively in online service
quality research. A recent study that has utilised the
measure (Kim et al., 2006) found that online
apparel retailers are failing on specific service
dimensions leading to dissatisfaction on the part of
their consumers. Such insights provide critical
insights and have the potential to assist apparel
retailers in improving their service and thus increase
their success in the commercial arena. In this study
the E-S-QUAL instrument will be applied to a
narrowly focused business context as has been done
by other researchers who have sought to identify the
key dimensions of service quality in contexts such as
online banks, or travel agencies (e.g. Jun and Cai,
2001; Van Riel et al, 2001).
3 RESEARCH METHODOLOGY
Having reviewed the relevant literature, the decision
was taken to use the E-S-Qual questionnaire
(Parasuraman et al., 2005). A well known, Dublin
based online retailer was chosen to host the
questionnaire. This portal assists 25 vendors to
maximise their online selling potential through
advertising special offers, co-ordinating deliveries
and taking advantage of Internet business models. It
was felt that as there was a mix of businesses selling
goods ranging from holidays to flowers, there would
be a good cross-section of customer types in terms
of ages, tastes, and spending power. Using the
portal as a host would have the added advantage of
targeting the research at the correct population; those
who regularly shop on line.
The authors met with the portal's Marketing
Manager and Web Content Manager to discuss the
possibility of the research being carried out there.
The discussions with the managers culminated in an
agreement that the portal would host the
WEBIST 2008 - International Conference on Web Information Systems and Technologies
380

questionnaire on each of their 25 partner stores. It
was also decided that three managers from each of
the stores (vendors) would complete an online
questionnaire similar to the customers so that
responses to the same statements could compared.
The authors agreed to provide a confidential report
for each individual vendor as well as a comparative
report for the online portal.
The final survey utilised, based on the
Parusaman et al., (2005) questionnaire, was divided
into two sections, 1 & 2 and set up in a web-based
format. Customers completed Sections 1 and 2 and
vendors completed Section 1 only. In Section 1 of
the survey a varying number of questions were
asked regarding several dimensions of online service
quality. The owners of the online gift website
requested that the questions relating to compensation
be omitted from the final questionnaire as they
viewed these questions as introducing a negative
view of interactions with the website.
Table 1: eService Quality Dimensions.
eService Quality
Dimension
Number of
Questions
Efficiency 8
System availability 4
Fulfilment 7
Privacy 3
Responsiveness 5
Efficiency 8
Compensation* 3
Contact 3
Perceived value 4
Loyalty intentions 5
* Dimension omitted on request of online vendor
In addition, a statement on the influence of the
service quality dimension on the consumer’s trust
beliefs was also included. For example, in relation
to the dimension of website efficiency, customers
were asked to address the following: The ease of use
of a website increases my trust in the on-line vendor.
Section 2 of the survey collected demographic
information on the respondents.
In order to obtain participation in the study, the
Web Content Manager emailed customers to ask
them to take part in the web-based survey. The data
obtained from the questionnaire was converted into
Excel and analysed using SPSS (Statistical Package
for the Social Sciences), a widely used programme
for statistical analysis.
4 RESULTS
4.1 Response Rates
A survey was undertaken for this research, and the
URL link to the survey web site was sent in the
participating company newsletter, via email to the
5,000 people who were registered customers. 84
respondents completed the questionnaire within 1
week of the initial notification. This represents
1.68% of the sample. A second notification was sent
by email 3 weeks later, which increased the number
of respondents to 119. This represents an increase of
43% to a total sample response rate of 2.38%. One
possible explanation for the low response rate is the
difficulty in checking the validity and continued
operation of the email addresses. This response rate
is despite the incentive of entry into a draw for a free
prize. The second mailing succeeded in increasing
the response rate from 1.68% to 2.38%. Within the
responses received 25% completed section 1 in full,
and all 119 completed section 2. This gives the
figure 0.6% as the percentage of the total sample that
returned a fully completed questionnaire for section
1, and 2.38% for section 2.
4.2 Reliability Analysis
The E-S-QUAL scale (Parasuraman, Zeithaml and
Berry, 2005) outlined four constructs for website
service quality and developed a scale by which these
constructs can be measured in relation to their
influence on perceived value and consumers’ loyalty
intentions. For the purpose of this study, it was
decided to also examine the relationship between
each of these four website service quality
dimensions and the online consumers trust response.
Table 2 shows the Cronbach’s alpha values for
each of the constructs. All of the constructs worked
well with this sample with the four constructs
‘Efficiency’, ‘Fulfilment’, ‘Responsiveness’ and the
‘Loyalty Intentions’ providing particularly strong
internal reliability measures.
WEBSITE SERVICE QUALITY IN IRELAND - A Consumer Perspective
381
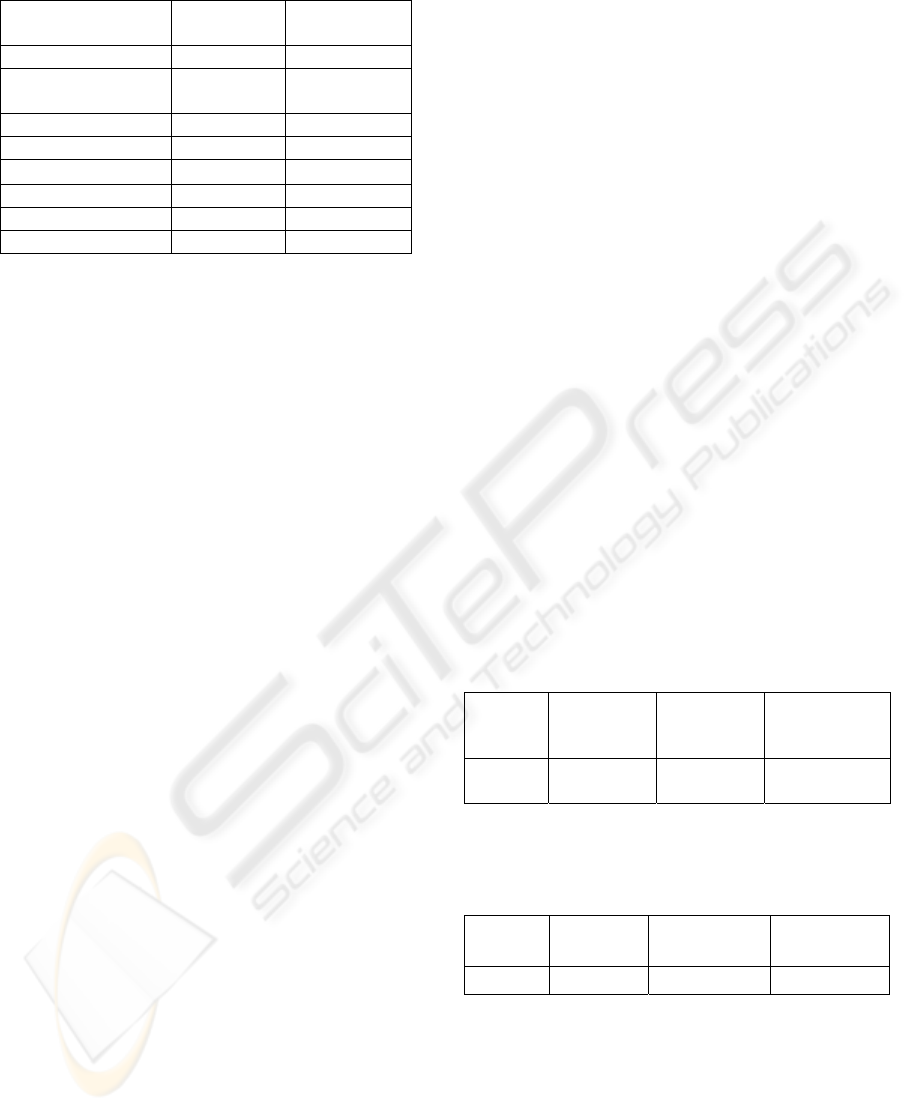
Table 2: Reliability Analysis – Scale (Alpha).
Construct Number
of Items
Cronbach’s
Alpha
Efficiency 8 0.95
System
Availability
4 0.86
Fulfilment 7 0.94
Privacy 3 0.88
Responsiveness 5 0.95
Contact 4 0.85
Perceived Value 4 0.87
Loyalty Intentions 5 0.96
4.3 Correlation Results
Having secured reliability measures for the variables
the measure of association between pairs of
variables was now examined using correlation
techniques. Correlation is a statistical technique that
provides a measure of the association between two
variables i.e. how strongly the variables are related,
or change, with each other. In order to test the data
a simple average for each of the related questions
was calculated for each construct and the
relationship between the variables then considered.
The correlation coefficient results are displayed in
appendix 1.
The website service quality constructs showing
the strongest inter-relationships are system
availability with privacy (0.84), and efficiency with
system availability (0.80). The weakest inter-
relationships are those of fulfillment with contact
(0.39) and privacy with contact (0.53). The
relationships between the website service quality
constructs and the dependent variables were then
examined. In relation to the dependent variable
‘perceived value’, the strongest result is provided by
the responsiveness construct (0.87), followed by the
system availability construct (0.81). The weakest
relationship is that between contact and perceived
value (at 0.72).
In relation to the dependent variable ‘loyalty
intentions’, the results again show a positive
relationship between the dependent and independent
variables. However, the website service quality
dimensions show a slightly weaker relationship with
customer loyalty than with perceived value.
Efficiency has the strongest influence on customer
loyalty at 0.76 and this is followed by system
availability at 0.68. This indicates that website
attributes exert a strong influence on the loyalty
intentions of online customers. Interestingly,
fulfillment and privacy were the website service
quality variables with the weakest relationships with
loyalty intentions at 0.62 each.
Finally, the results indicate a positive
relationship between each of the dependent
variables. The strongest level of association was
that between trust and perceived value (0.76), with
the next strongest being that between perceived
value and loyalty intentions (0.72) and the weakest
of these relationships being that between trust and
loyalty intentions (0.60).
4.4 Regression Analysis
Multiple regression techniques were used in this
study to establish whether the set of independent
variables could explain a proportion of the variation
in the dependent variables at a significant level, and
to establish the relative predictive importance of the
independent variables. The independent variables
were: Efficiency, System Availability, Fulfilment,
Privacy, Responsiveness and Contact. The
dependent variables are Perceived Value and
Loyalty Intentions. The results, outlined in tables 3
and 4 show that these independent website service
quality variables explain 87% of the variation in
perceived value and 69% of the variation in loyalty
intentions respectively.
Table 3: Model Summary: Perceived Value.
R R Square
Adjusted
R Square
Std.
Error
of Estimate
.936
(a)
.876 .844 .28194
Independent variables: Efficiency, System Availability,
Fulfillment, Privacy, Responsiveness, Contact. Dependent
variable: Perceived Value
Table 4: Model Summary: Loyalty Intentions.
R R Square
Adjusted R
Square
Std. Error of
the Estimate
.829(a) .687 .605 .51010
Independent variables: Efficiency, System Availability,
Fulfillment, Privacy, Responsiveness, Contact.
Dependent variable: Loyalty Intentions
The F-statistics for each of the relationships
reported above indicate that with 99.9% confidence,
we can assert that there is a systematic relationship
between the dependent variables and the set of
independent variables. Thus, at least one of the
WEBIST 2008 - International Conference on Web Information Systems and Technologies
382

independent variables is explaining changes in the
dependent variable.
Predictive Importance of Independent Variables.
Perceived Value: The coefficient results indicate that
two of the independent variables – system
availability (coefficient beta weight 0.390) and
responsiveness (coefficient beta weight 0.371) -
exert the strongest effect on the dependent variable
perceived value. Fulfilment and contact are
significant independent variables – but to a lesser
degree. Each of these variables is positively related
to the dependent variable.
Loyalty Intentions: The coefficient results
indicate that two of the independent variables -
fulfilment (coefficient beta weight 0.355) and
contact (coefficient beta weight 0.329) - exert the
strongest effect on the dependent variable Loyalty
Intentions. However, none of the independent
variables are statistically significant. This result
contradicts the results of the F-test that indicated
with 99.9% confidence that there was a systematic
relationship in this case. This contradiction is a
typical outcome where independent variables are
highly correlated with one another – where
multicollinearity is present. The coefficient results
for both dependent variables are shown in appendix
1.
5 DISCUSSION
The study findings provide evidence of a strong
relationship between the system availability and
privacy dimensions of website service quality. This
indicates that consumers’ evaluation of a website as
reliable (in terms of availability for business)
appears to result in a parallel evaluation of the
vendor as likely to take adequate measures to protect
their personal information. The findings also
confirm a strong inter-relationship between system
availability and efficiency, confirming the close
association between these dimensions of website
service quality in the mind of the consumer.
An interesting distinction emerged in terms of
the difference between contact and responsiveness.
For example, the results show that consumers’
perception of value is positively influenced by
vendor responsiveness but negatively influenced by
contact. This indicates that while consumers
perceive aspects of responsiveness such as the
ability to take care of consumer problems, to handle
product returns well, and to tell the consumer what
to do if a transaction is not processed as adding
value to their service interaction with the vendor, all
contact must be initiated by the consumer as non-
solicited contact (e.g. as with event notification
emails) is perceived as an infringement of privacy.
The service quality variable with the strongest
ability to influence consumers’ perception of value
is efficiency, followed by system availability, again
confirming the inter-relationship between these two
variables. Similarly, in relation to consumers’
loyalty intentions, the dimensions of website service
quality that provide the strongest explanatory power
are efficiency and system availability respectively.
These results indicate that technical website
attributes such as ease of use and reliability have
strong potential to influence perceived value and
customer loyalty and outweigh consumers’
fulfillment and privacy concerns. Vendors seeking
to increase consumer’s perception of value and
intention to re-purchase from the website should
therefore focus on the ease of use of the website
customer interface and the reliability of their
websites.
While previous research has argued that privacy
of websites may not be critical for more frequent
users (Wolfinbarger and Gilly, 2003), the results of
this study indicate otherwise. For example, the
majority of respondents in this study were
reasonably frequent purchasers from this gift
website (29% purchased on a monthly basis and
33% purchased every 2-3 months) spending an
average of €50-€149 per transaction. While
experience may mitigate concerns about website
security, it clearly does not mitigate the influence of
privacy concerns on the online consumers’ trust
response.
Finally, the use of the E-S-QUAL measurement
instrument in an Irish context provided interesting
insights into the critical facets of website service
quality valued by Irish consumers. The authors of
the E-S-QUAL instrument had previously applied it
in the United States. Based on their results they
concluded that the most critical and equally
important E-S-QUAL dimensions were the
efficiency and fulfillment dimensions and that
customers’ assessment of a website on these two
dimensions would have the strongest influence on
perceived value and loyalty intentions. In this study
the full measurement instrument (comprising E-S-
WEBSITE SERVICE QUALITY IN IRELAND - A Consumer Perspective
383

QUAL and E-RecS-QUAL) was applied and the
results obtained differ considerably from those of the
instrument authors. For example, system
availability and responsiveness respectively were the
dimensions of website service quality shown to exert
the strongest effect on perceived value, while in
relation to loyalty intentions, the variables fulfilment
and contact exert the strongest effect.on the
dependent variable. System availability is a
significant independent variable – but to a lesser
degree. However, due to the limitations relating to
sample size further research is necessary to establish
whether or not the E-S-QUAL model is culture
independent. At present, all that can be concluded is
that this study has provided results that indicate that
online consumers in Ireland differ in terms of the
facets of website service quality that most influence
their perceptions of value and their loyalty
intentions.
6 CONCLUSIONS
One of the limitations of this study relates to the
sample size, a fact that was beyond the control of the
authors. Secondly, the company used in the study
was an online gift store. The fact that those
purchasing from this website are purchasing
products that they will not be consuming themselves
may lead to a different emphasis on certain facets of
service quality. In order to ascertain whether this
could indeed be the case, it is necessary to conduct
further website service quality studies of websites
where the consumer is purchasing the product for
their own use. Thirdly, the online vendor in this
study requested that the items on compensation
should not be included in the questionnaire, as the
company did not provide product compensation
assurances. This resulted in one of the E-RecS-Qual
sub dimensions being omitted from the study.
While the E-RecS-QUAL section of the study is
secondary to the E-S-QUAL section, which was
represented in full, it is nevertheless a point that
should be noted as the other two sub dimensions of
E-RecS-QUAL were included in this study. Finally,
this study extended the E-S-QUAL model by
introducing a number of trust items relating to each
of the service quality dimensions. However, it is not
claimed that these items provide an extensive
representation of consumer trust in the online vendor
and further research to specifically measure the
influence of website service quality on online
consumers’ trust responses would be valuable.
The study also contributes to the small but
growing body of work that exists on website service
quality and provides insight into the use of the E-S-
QUAL instrument in an Irish context. The insights
provided by this study will also be of benefit to
practitioners in their efforts to compete for and
retain customers in the competitive electronic
commerce marketplace.
REFERENCES
Ahmad, S. (2002) “Service Failures and Customer
Defection: A Closer Look at On-line Shopping
Experiences.” Managing Service Quality, 12 (1) 19-
29.
Amarach Consulting TrendWatch Technology Report,
Quarter 2, 2002. Available at
http://www.amarach.com/news/press.htm
Asubonteng, P., McCleary, K.J., Swan, J. (1996),
"Servqual revisited: a critical review of service
quality", Journal of Services Marketing, 10 (6) 62-81.
Babakus, E., Boller, G.W. (1992), "An empirical
assessment of the SERVQUAL scale", Journal of
Business Research, 24 (3), 253-68.
Babakus, E., Mangold, G.W. (1989), "Adapting the
SERVQUAL scale to hospital services: an empirical
investigation", Hospital Services Research, 26 (6)
767-86.
Barnes, S. J. and Vidgen, R.T. (2002) “An Integrative
Approach to the Assessment of E-Commerce Quality”
Journal of Electronic Commerce Research 3 (3) 114 –
27.
Bebko, C.P., Garg, R.K. (1995), "Perceptions of
responsiveness in service delivery", Journal of
Hospital Marketing, 9 (2) 35-45.
Bitner, M.J. (1990), "Evaluating service encounters: the
effects of physical surroundings and employee
responses", Journal of Marketing, 54 (2), 69-82.
Bowers, M.R., Swan, J.E., Koehler, W.F. (1994), "What
attributes determine quality and satisfaction with
health care delivery?", Health Care Management
Review, 19 (4), 49-55
Cai, S. and Jun. M. (2003) “Internet Users Perceptions of
On-line Service Quality: A Comparison of On-line
Buyers and Information Searchers”, Managing Service
Quality, Vol 13, No 6, pp 504 – 519.
Carman, J.M. (1990), "Consumer perceptions of service
quality: an assessment of the SERVQUAL
dimensions", Journal of Retailing, 66 (1), 33-55.
Cox, J., and Dale, B.G. (2001) “Service Quality and e-
Commerce: An Exploratory Analysis”, Managing
Service Quality, Vol. 1, No. 2, pp 121 –131.
Cronin, J.J., Taylor, S.A. (1994), "SERVPERF versus
SERVQUAL: reconciling performance-based and
perception-minus-expectations measurement of
service quality", Journal of Marketing, 58 (1), 125-31.
WEBIST 2008 - International Conference on Web Information Systems and Technologies
384

Cronin, J., Taylor, S.A. (1992), "Measuring service
quality: a reexamination and extension", Journal of
Marketing, 56 (July), 55-68.
Doney, P.M., Cannon, J.P., and Mullen, M.R. (1998),
‘Understanding the Influence of National Culture on
the Development of Trust’, Academy of Management
Review, Vol. 23 (3), pp.601-620.
Finn, D., Lamb, C. (1991), "An evaluation of the
SERVQUAL scale in a retailing setting", Advances in
Consumer Research, 18, 483-90.
Fukuyama, F. (1995), Trust: The Social Virtues and the
Creation of Prosperity. New York, Free Press.
Gaudin, S. (2003) “ Companies Failing at On-line
Customer Service” Retrieved from
http://itmanagement.earthweb.com/erp/article.php/158817
1
Gefen, D. and Heart, T. (2006) “On the Need to Include
National Culture as a Central Issue in E-Commerce
Trust”, Journal of Global Information Management,
Vol. 14, Issue 4, pp 1-30.
Grönroos, C (1983), Strategic Management and Marketing
in the Service Sector, Marketing Science Institute,
Cambridge, MA .
Hofstede, G. H. (1984). Culture’s Consequences:
International Differences in Work-Related Values.
Beverly Hills, CA.: Sage Publications.
Lehtinen, J.R and Lehtinen, U. (1982), "Service quality: a
study of quality dimensions", Unpublished working
paper, Service Management Institute, Helsinki .
Loiacono, E, Watson, R.T., Goodhue, D. (2000)
“WebQual: A Web Site Quality Instrument,” Working
paper, Worcester Polytechnic Institute.
Long, M. and McMellon, C. (2004) “Exploring the
determinants of retail service quality on the Internet”,
Journal of Services Marketing, 18(1), pp.78–90.
Parasuraman, A., Zeithaml, V.A., and Malhotra, A.
(2005) “E-S-Qual: A Multiple Item Scale for
Measuring Electronic Service Quality”, Journal of
Service Research 7, (3), 213 – 233.
Parasuraman, A., Zeithaml, V.A., Berry, L.L. (1988),
"SERVQUAL: a multiple item scale for measuring
customer perceptions of service quality", Journal of
Retailing, 64 (1), 12-40.
Parasuraman, A., Zeithaml, V.A., Berry, L. "1985", in A
conceptual model of service quality and its
implications for future research (Eds), Journal of
Marketing, 49 (Fall), 41-50.
Paulin, M and Perrien, J. (1996) Measurement of Service
Quality: The Effect of Contextuality, in Kunst and
Lemminck (eds.) Managing Service Quality, London,
Chapman.
Santos, J. (2003), "E-service quality: a model of virtual
service quality dimensions", Managing Service
Quality, Vol. 13 No.3, pp.233-46
Shaffer, Teri Root and Bradley S. O’Hara (1995), “The
Effects of Country of Origin on Trust and Ethical
Perceptions”, The Service Industries Journal, Vol.
15,
(April), pp. 162-179.
Swartz, T.A., Brown, S.W. (1989), "Consumer and
provider expectations and experience in evaluating
professional service quality", Journal of the Academy
of Marketing Science, 17, 189-95.
Szymanski, D. M and Hise, R. T. (2000) “e-Satisfaction:
An Initial Examination,” Journal of Retailing, 76 (3),
309 – 22.
Teas, K.R. (1993), "Consumer expectations and the
measurement of perceived service quality", Journal of
Professional Services Marketing, 8 (2), 33-53.
Trabold, L. M., Heim, G., Field, J, (2006) “Comparing e-
service performance across industry sectors: Drivers of
overall satisfaction in online retailing” International
Journal of Retail & Distribution Management, Vol 34,
No 4/5, pp. 240 – 257.
Van Iwaarden, J., Van der Wiele, T., Ball, L., Millen, R.
(2004) “Perceptions about the Quality of Websites: A
survey amongst students and Northeastern University
and Erasmus University”, Information and
Management, 41 (8), 947 – 959.
Van Riel, A., Liljander V., and Jurriëns P. (2001),
Exploring Consumer Evaluations of E-Services: A
Portal Site, International Journal of Service Industry
Management, Vol. 12, No 4, pp. 359-377.
Wolfinbarger, M. and Gilly, M.C. (2003) “eTailQ:
Dimensionalizing, Measuring, and Predicting etail
Quality,” Journal of Retailing, 79 (3) 183 – 98.
Woodside, A.G., Frey, L.L., Daly, R.T. (1989), "Linking
service quality, customer satisfaction, and behavioral
intention", Journal of Health Care Marketing, 9 (4), 5-
17.
Yoo, B. and Donthu, N. (2001) “Developing a Scale to
Measure the Perceived Quality of an Internet
Shopping Site (Sitequal) Quarterly Journal of
Electronic Commerce, 2 (1) 31 – 46.
Zeithaml, V. (2002), "Service quality in e-channels",
Managing Service Quality, Vol. 12 No.3, pp.135-8.
Zucker, L.G. (1986), ‘Production of Trust: Institutional
Sources of Economic Structure, 1840 – 1920’, In
Staw, B.M., and Cummings, L.L. (eds.), Research in
Organizational Behavior, Vol. 8, pp. 53-111. JAI
Press, Greenwich, CT.
WEBSITE SERVICE QUALITY IN IRELAND - A Consumer Perspective
385

APPENDIX
Correlation Coefficient Results
Correlation
1
2
3
4
5
6
7
8
Efficiency (1) 1.
00
0.80 0.56 0.67 0.82 0.71 0.79 0.76
System Availability (2) 1.00 0.60 0.84 0.73 0.53 0.81 0.68
Fulfillment (3) 1.00 0.78 0.63 0.39 0.73 0.62
Privacy (4) 1.00 0.75 0.53 0.80 0.62
Responsive (5) 1.00 0.71 0.87 0.72
Contact (6) 1.00 0.72 0.69
Perceived Value (7) 1.00 0.72
Loyalty Intentions (8) 1.00
Regression Coefficient Results: Perceived Value
Unstandardized
Coefficients
Standardized
Coefficients t Sig.
B
Std.
Error Beta
1 (Constant)
-.790 .441 -1.794 .086
Efficiency
-.099 .177 -.093 -.560 .581
System Av
.425 .192 .390 2.212 .037
Fulfillment
.335 .140 .295 2.389 .025
Privacy
-.100 .183 -.102 -.548 .589
Responsiveness
.356 .147 .371 2.423 .024
Contact
.247 .112 .249 2.197 .038
Regression Coefficient Results: Loyalty Intentions
Model
Unstandardized
Coefficients
Standardized
Coefficients t Sig.
B
Std.
Error
Beta
1 (Constant)
-.863 .797 -1.083 .290
Efficiency
.284 .320 .235 .886 .385
System Av
.326 .347 .263 .938 .358
Fulfillment
.460 .254 .355 1.810 .083
Privacy
-.281 .330 -.253 -.852 .403
Responsiveness
.068 .266 .062 .255 .801
Contact
.371 .203 .329 1.826 .081
WEBIST 2008 - International Conference on Web Information Systems and Technologies
386
