
NOVEL TECHNIQUES FOR AUTOMATICALLY ENHANCED
VISUALIZATION OF CORONARY ARTERIES IN MSCT DATA AND
FOR DRAWING DIRECT COMPARISONS TO CONVENTIONAL
ANGIOGRAPHY
Marion J¨ahne, Christina Lacalli* and Stefan Wesarg*
Technische Universit¨at Darmstadt, Department of Graphic Interactive Systems, Rundeturmstr. 10, 64283 Darmstadt, Germany
*Fraunhofer IGD, Department of Cognitive Computing & Medical Imaging, Fraunhoferstr. 5, 64283 Darmstadt, Germany
Keywords:
Cardiac imaging, MSCT, coronary arteries, conventional coronary angiography, DRR, visualization.
Abstract:
The new generation of multi-slice computed tomography (MSCT) scanners enables the radiologist to assess
the coronary arteries in a non-invasive way. The question of particular interest is whether the quality of the
findings based on MSCT data can compete with the gold standard - the coronary angiography. In this work
we present novel automated methods for a reliable visualization of coronary arteries and for drawing direct
visual side-by-side comparisons to conventional angiograms. Our approach comprises a new method for
automatically extracting the heart from cardiac CT data and an advanced masking method for eliminating large
cardiac cavities to obtain a better visibility of the coronary arteries in the rendered CT data. For drawing direct
side-by-side comparisons we present a novel approach for simulating the conventional coronary angiography
in an easy-to-handle manner. The new methods have been developed for and tested with contrast-enhanced
cardiac CT datasets.
1 INTRODUCTION
In this work we present novel techniques for direct
volume rendering of the coronary arteries from car-
diac MSCT data and for drawing side-by-side com-
parisons to conventional angiographyin an automated
manner.
Coronary artery disease (CAD) and its compli-
cations such as myocardial infarction are among the
main causes of death in the western world. CAD most
often results from a decrease of the cross-sectional
area of the coronary arteries. Therefore, a reliable
detection of those narrowed areas – the so-called
stenoses – is of high importance for diagnosis and in
order to plan a possible treatment.
For years, the coronary angiography was the gold
standard for the assessment of the coronary artery tree
– in spite of the fact that it is an invasive modality and
therefore associated with potential negative implica-
tions for the patient. The new generation of MSCT
scanners allows the analysis of the coronary arteries
in a non-invasive way. The question of particular in-
terest is whether the quality of the findings based on
these image data can compete with the conventional
coronary angiography. To answer this question a re-
liable representation of the coronary arteries that is
comparable to the representation in conventional an-
giograms is required. Further on, registration and
matching of these representations allow transfering
positions of potential pathologies (stenoses, calcifi-
cation) detected in CT data to angiograms and vice
versa.
Typically, cardiac CT data also includes non-cardiac
structures such as ribs or the sternum which partially
block the view at the heart and at the coronary arter-
ies (see Figure 2 (a)). In this work we present an au-
tomated approach for extracting the heart from car-
diac CT data for a better visibility of the coronary ar-
teries. However, drawing direct visual comparisons
between corresponding pathologies remains difficult.
This is because on one hand, only parts of the coro-
nary arteries are visible. On the other hand, manually
achieving a viewing direction adequate to that in con-
ventional angiography is very inaccurate. We present
an additional method, that automatically generates so
called digitally reconstructed radiographies (DRRs)
from the CT data by simulating the conventionalcoro-
nary angiography. Representations of the coronary ar-
290
Jähne M., Lacalli C. and Wesarg S. (2008).
NOVEL TECHNIQUES FOR AUTOMATICALLY ENHANCED VISUALIZATION OF CORONARY ARTERIES IN MSCT DATA AND FOR DRAWING
DIRECT COMPARISONS TO CONVENTIONAL ANGIOGRAPHY.
In Proceedings of the Third International Conference on Computer Vision Theory and Applications, pages 290-296
DOI: 10.5220/0001082102900296
Copyright
c
SciTePress
original CT data
threshold selection
method by Otsu
DRR generationvolume rendering
centre of gravity
computation
binarization
erosion
radial search rays
generation of
binary mask
neighborhood filter
dilatation
binary mask (3D)
to eliminate
cardiac cavities
binary mask (3D)
to eliminate non-cardiac
structures
XX
X
combined mask
masked CT data
DRR with whole
coronary artery tree
volume rendering
CT data without
non-cardiac structures
and large cardiac cavities
CT data without
non-cardiac structures
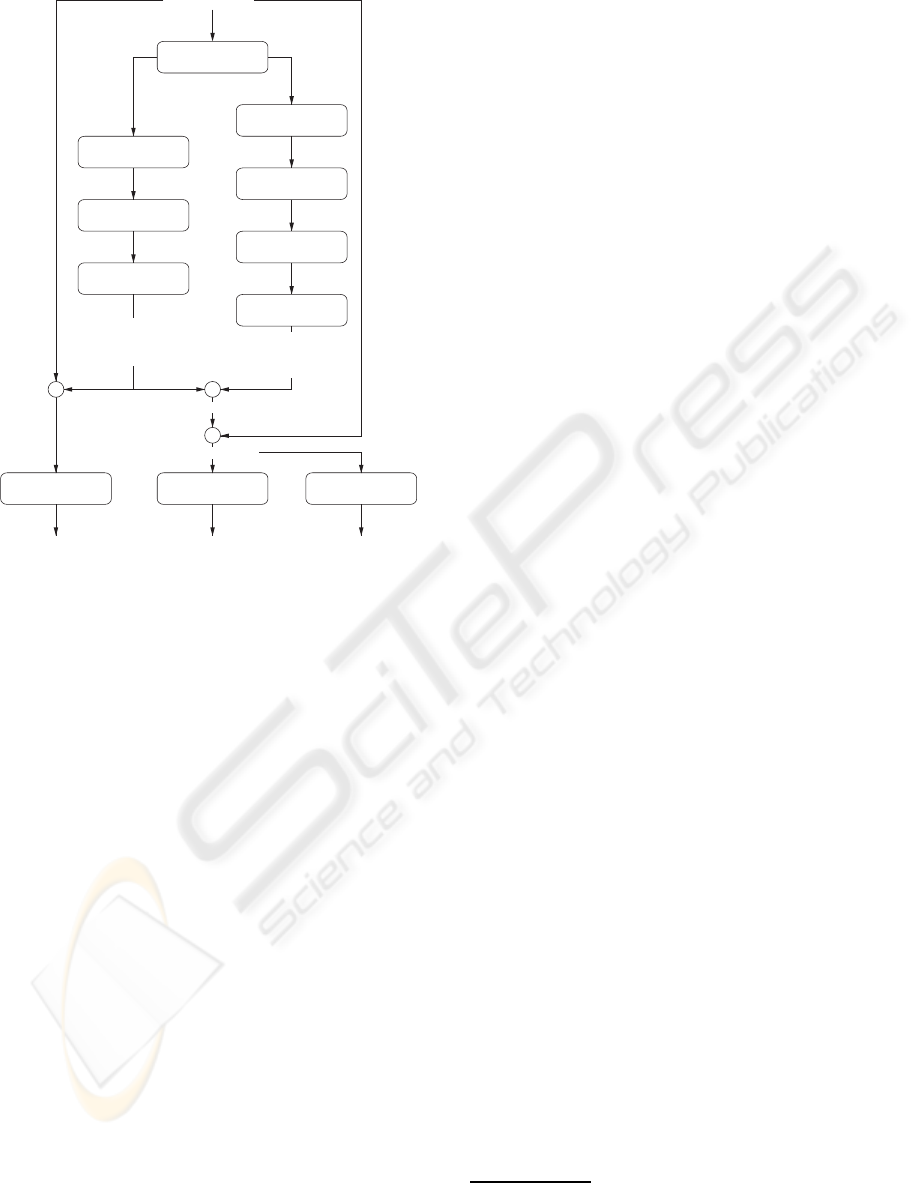
Figure 1: Our three possibilities for the visualization of
coronary arteries from CT data. Left: Volume rendered CT
data without displaying spurious non-cardiac structures (see
Figure 2 (b)). Middle: Generated DRR from masked CT
data. Both, non-cardiac structures and large cardiac cavities
are eliminated (see Figure 6 (b)). Right: Volume rendered
CT data without displaying non-cardiac structures and large
cardiac cavities (see Figure 5 (b)).
teries generated this way, can easily be compared with
conventional angiograms.
2 STATE OF THE ART
2004 Lorenz et al. developed a method for the ex-
traction of the heart from cardiac CT datasets (Lorenz
et al., 2004). They locate the chest wall and the de-
scending aorta in all slices of the CT data in order to
roughly estimate the location of the heart. Afterwards
they use active contours to delineate the border of the
heart in a slice-by-slice manner.
A reliable visual comparison between cardiac
structures represented in 3D CT data and in 2D an-
giograms respectively, requires similar representa-
tions of those structures. In general, there are two
possibilities to meet this requirement. Either, 3D re-
construction of the coronary arteries from a series of
2D angiograms or the opposite way around, project-
ing the CT data to a 2D image plane and compare
these 2D images with conventional angiograms. In
(Sang et al., 2006), (Großkopf and Hildebrand, 1997)
and (Blondel et al., 2006) a 3D model of the coro-
nary artery tree is reconstructed by segmenting the
coronary artery tree. This 3D representation can be
compared with the coronary tree extracted from the
CT data. In (Schnapauff et al., 2007) emulation of
conventional angiography is performed by segment-
ing the coronary arteries in the CT data and displaying
the results by volume rendering techniques.
3 MATERIAL AND METHODS
In the following section, we describe our set of new
approaches for an enhanced visualization of the coro-
nary arteries in cardiac CT data (see Figure 1 for an
overview). First, we present a new method for ex-
tracting the heart, followed by an advanced masking
of large cardiac cavities to clearly visualize the whole
coronary artery tree in a volume rendering of the CT
data. The latter serves as a basis for the generation
of DRRs to simulate conventional coronary angiogra-
phy.
3.1 Image Acquisition
A total of 25 contrast-enhanced CT datasets were ac-
quired by 16-slice
1
and 64-slice
2
CT scanners. The
number of voxels in x- and y-direction constantly
amounts 512 × 512 voxels and varies in z-direction
from 176 to 441. The size of one voxel in x- and y-
direction is identically, varying from 0.41 to 0.54 mm,
and averages 0.5 mm along the z-axis. The gray level
values of the CT data are normalized values of the
computed X-ray attenuation coefficients, expressed in
Hounsfield Units (HU) (Hounsfield, 1992). Typically,
the CT data includes 4096 gray level values (12 bit).
In 8 out of 25 cases X-ray coronary angiography
was performed
3
in addition to the CT data acquisition.
The resolution of the angiograms amounts 512 × 512
pixels and they were digitized with 8 bit, thus the gray
level values lie in between 0 and 255.
3.2 Enhanced Direct Volume Rendering
of the Heart
When displaying the original CT data by volume ren-
dering techniques non-cardiac structures such as ribs
1
SIEMENS Somatom Session 16
2
GE Light Speed VCT
3
SIEMENS HICOR/ACOM-TOP, PHILIPS Integris H
NOVEL TECHNIQUES FOR AUTOMATICALLY ENHANCED VISUALIZATION OF CORONARY ARTERIES IN
MSCT DATA AND FOR DRAWING DIRECT COMPARISONS TO CONVENTIONAL ANGIOGRAPHY
291
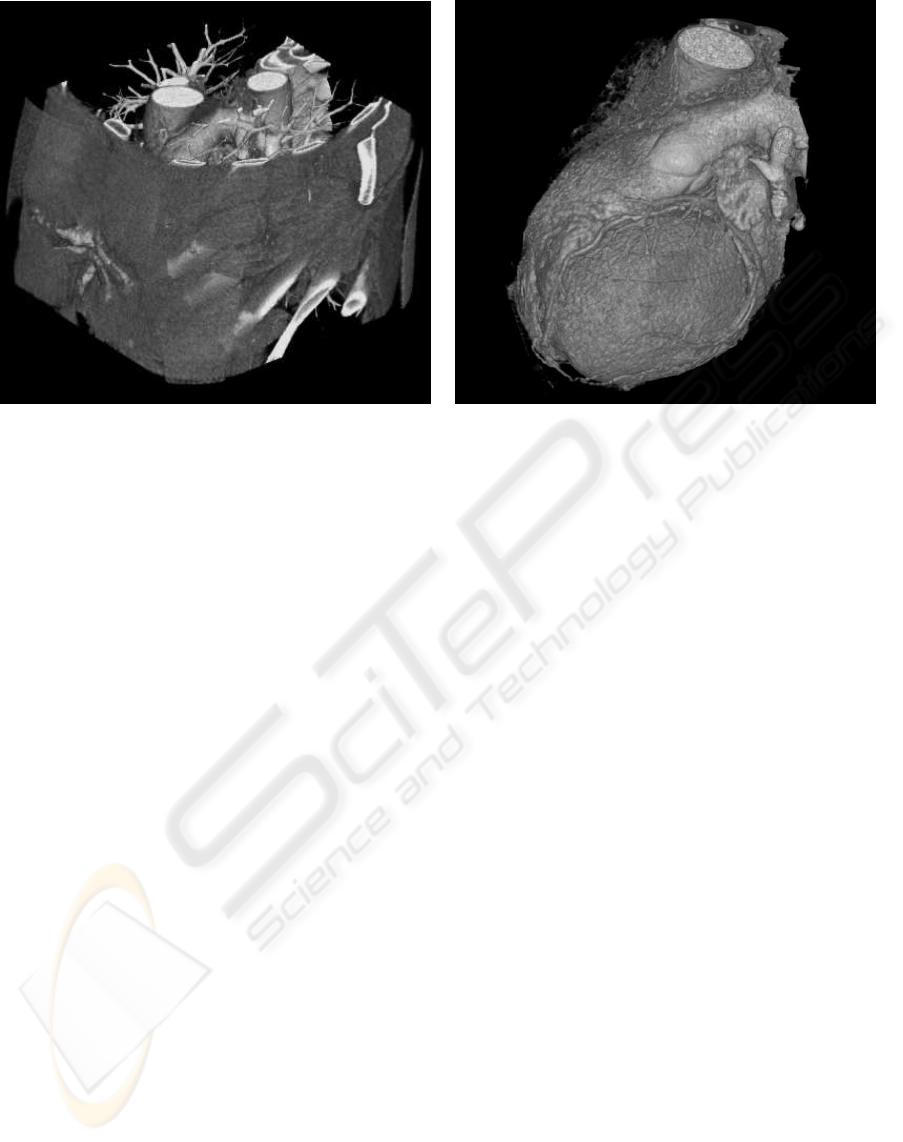
(a) (b)
Figure 2: Volume rendered cardiac CT data. (a) Non-cardiac structures such as ribs or the sternum block the view at the heart
and at the coronary arteries. (b) After applying the mask generated in 3.2 the heart and single branches of the coronary arteries
are clearly visible.
or the sternum block the view at the heart and at the
coronary arteries (see Figure 2 (a)). Here, we present
our new approach for eliminating those structures in
order to obtain a clear view at the heart and at parts
of the coronary artery tree in the volume rendered CT
data.
Our approach for automatically extracting the heart
from cardiac CT data consists of the following two
steps. First, we use a statistical method to compute a
point in the middle of the heart in all axial slices of
the CT data. From this point we send out a search ray
pattern to detect the outer boundary of the heart.
The gray level values of the CT data expressed in
HU represent a linear transformation of the measured
X-ray attenuation coefficients. Thus, the gray level
values correlate with the different anatomical struc-
tures (air -1000 HU, water 0 HU, bone +1000 up to
+3000 HU). In order to obtain a clear partition of the
anatomical structures, we use Otsu’s method of auto-
matic threshold selection from gray level histogram
for image segmentation (Otsu, 1979). An optimal
set of thresholds is selected by the discriminant cri-
terion; namely by maximizing the measure of separa-
bility of the resultant classes in gray levels. With two
thresholds the voxels of the original CT data are di-
chotomized into three gray level classes. The darkest
gray level corresponds to air, the middle one corre-
sponds to fat and muscle tissue and the brightest gray
level corresponds to bones and the contrast-enhanced
cardiac structures (see Figure 3 (b)). As the result of
the computation of the center of gravitiy of the two
brightest gray levels we obtain a point in the middle
of the heart.
In the axial slices of the labeled CT data the out-
line of the heart can be approximated by a circle or
an ellipse. Therefore, from the computed center of
gravity in the middle of the heart a radial search ray
pattern (von Berg, 2005) is send out in order to detect
the outer boundary of the heart. Clear bright-to-dark
transitions from the heart to the surrounding tissue are
found. At locations with overlaying structures, like
the aorta and the sternum, the search rays are too long
(see Figure 3 (b)) and need to be cut in a subsequent
step. On each side of the aorta and the sternum the last
rays which hit on lung tissue and therefore have the
correct length are automatically detected . The length
of the rays which lie between these rays is corrected
by interpolating their new length from the length of
the detected rays (see Figure 3 (c)). Afterwards the
endpoints of the search rays are stored and then con-
nected to get the outline of the heart in every axial
slice. We obtain the binary mask by filling up the in-
ner of the 2D outer boundary of the heart.
By applying the generated mask to the original CT
data and by rendering these data, the heart and single
branches of the coronary artery tree are clearly visible
(see Figure 2 (b)).
VISAPP 2008 - International Conference on Computer Vision Theory and Applications
292
1
1
1
2
2
2
2
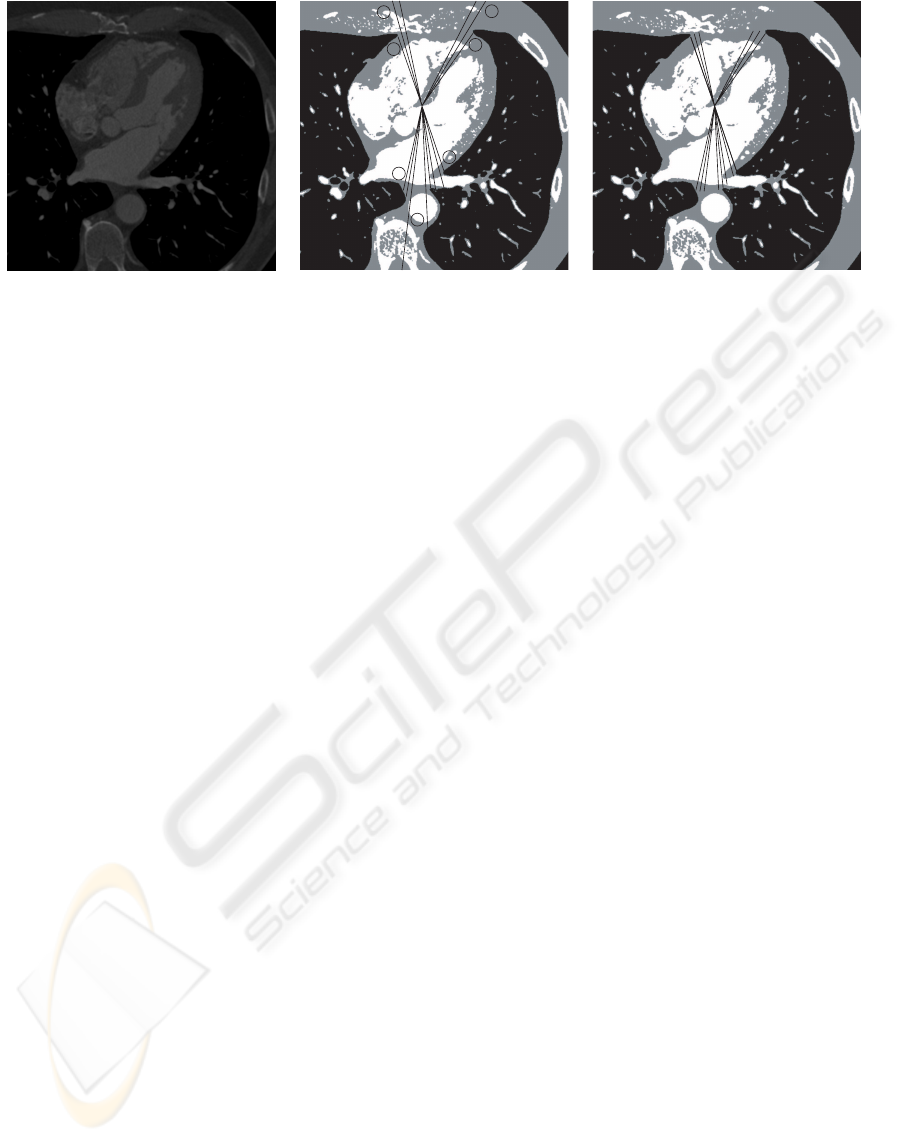
(a) (b) (c)
Figure 3: Detection of the outer boundary of the heart using the example of a single axial slice. (a) Original CT data. (b)
Labeled CT data after performing Otsu’s method. The gray labels 0 to 2 correspond to the anatomical structures air, fat and
muscle tissues, bone and contrast-enhanced cardiac structures. At locations with overlaying structures (sternum, aorta) the
search rays are too long (1). On each side the last rays which hit on the lung tissue, and therefore have the correct length, are
automatically detected (2). (c) The length of the rays (1) is corrected by interpolating their new length from the rays (2).
3.3 Drawing Side-by-Side Comparisons
The generation of DRRs from the original CT data
leads to insufficient results concerning the visibility
of the coronary artery tree in the projected images.
On one hand non-cardiac structures such as ribs block
the view at the heart. This problem can be fixed by
eliminating those structures (see 3.2). On the other
hand large cardiac cavities like ventricles and atria are
in addition to the coronary arteries contrast-enhanced
and occlude the coronary arteries in the projected im-
ages. The latter is because in the case of MSCT the
contrast medium is applied systemically and is not in-
jected directly into the coronary artery branches like
in conventional coronary angiography. We present an
advancedmasking of spurious cardiac cavities for bet-
ter visibility of the whole coronary artery tree. The
masked CT data serves as input for generating DRRs
in order to draw direct side-by-side comparisons to
conventional angiography.
3.3.1 Advanced Masking
Our approach for masking out spurious cardiac cav-
ities is based on morphological image processing
techniques and neighborhood filters. First, we per-
form a thresholding operation on the labeled CT data.
The highest label correlates with both, the contrast-
enhanced cardiac cavities and the contrast-enhanced
coronary arteries (see Figure 4 (a)). Thus, the result-
ing binary mask eliminates large structures correlat-
ing with the cardiac cavities as well as small struc-
tures correlating with the coronary arteries (see Fig-
ure 4 (b)). To avoid the masking of the coronary ar-
teries, we perform an erosion operation on the thresh-
olded data. This allows a clear seperation of coronary
arteries and cardiac cavities, even when they are in
close proximity to each other. Small areas of con-
nected pixels can be assigned to the coronary arteries
in the eroded data. We then apply a neighborhood
filter along each of the three orthogonal axes of the
dataset to remove those areas. As the size of the car-
diac cavities was reduced by eroding the data, we per-
form a dilatation operation for resizing purpose.
By applying the generated mask to the CT data af-
ter extracting the heart, the data can be rendered that
way that the whole coronary artery tree is clearly vis-
ible (see Figure 5 (b)).
3.3.2 DRR Generation
Simulating conventional coronary angiography re-
quires an appropriate projection model as well as in-
formation about the X-ray attenuation coefficients of
the different anatomical structures. In our approach,
a perspective projection model forms the geometrical
basis for the calculation of the DRRs. Obtaining com-
parable views to those of conventional angiograms,
requires general knowledge of the projection param-
eters such as the origin of the CT data, the position
of the center of the detector, or the position of the
virtual X-ray source. In our model we assume that
the central ray starting from the virtual X-ray source
passes directly through the virtual iso-center - that is
the center of the CT data - and the center of the de-
tector. This mimics the rigid geometry of the X-Ray
C-arm. The transformation to project one voxel of
the CT data to the detector plane can be expressed
in terms of a translation t, followed by a rotation
R = R
φ
x
· R
φ
z
around the transversal and longitudi-
nal axes of the volume, respectively, and a perspective
projection matrix P
perspective
. The angiograms are pre-
NOVEL TECHNIQUES FOR AUTOMATICALLY ENHANCED VISUALIZATION OF CORONARY ARTERIES IN
MSCT DATA AND FOR DRAWING DIRECT COMPARISONS TO CONVENTIONAL ANGIOGRAPHY
293

(a) (b) (c)
Figure 4: Advanced masking. (a) The highest gray level value in labeled CT data correlates with both, cardiac cavities and
coronary arteries. (b) Binary CT data after thresholding. The coronary arteries (arrows) must be excluded from masking.
(c) Masked CT data after applying the combined mask obtained in previous steps to the original CT data. Both, non-cardiac
structures and cardiac cavities are eliminated, whereas the coronary arteries (arrows) are still visible. The masked CT data
serves as input for the generation of DRRs.
sented in DICOM
4
format. Typically, its header file
contains acquisition specific information. By parsing
the DICOM header we obtain the relevant projection
parameters.
The transmitted intensity I of X-ray s, is given by,
I = I
0
· e
−
∑
µ
i
s
i
, (1)
whereas I
0
is the incident X-ray intensity and µ
i
are
the linear attenuation coefficients. The intensity of
one pixel of the DRR is computed by analysing the
exponent in Equation 1, i.e. by accumulating the gray
values of the CT data along each of the virtual X-
rays passing through the CT data. This procedure
conforms to a classical ray-casting approach as im-
plemented in (Schroeder et al., 2002).
4 RESULTS
We tested our approach for extracting the heart and
the advanced masking of large cardiac cavities with
all 25 CT datasets. In all cases we obtained clinical
useful results at a single press of a button (see Figure
2 (b) and Figure 5 (b)). The generation of DRR was
tested on those 8 CT datasets for which corresponding
conventional angiograms existed. In 5 out of 8 cases
spurious cardiac cavities could successfully masked,
while the run of the coronary arteries was clearly vis-
ible (see Figure 6 (b)). In the other 3 cases the quality
of the original CT data was reduced, e.g. the contrast
medium was not equally distributed. Therefore, the
coronary arteries were not sufficiently enhanced.
By generating the DRRs the radiologist obtains a
representation of the coronary tree that is morphologi-
4
Digital Imaging and Communications in Medicine
cally equivalent to conventional angiograms (see Fig-
ure 6 (a)-(b)). Right and left branches of the coronary
artery tree are visible in the projected images because
in the case of MSCT the contrast medium is applied
intravenously. For more similar representations we
clip the volume along the axial direction, projecting
only the relevant part of the CT data (see Figure 6
(c)).
5 CONCLUSIONS AND
DISCUSSION
The approaches presented in this work are new and
automated techniques for enhanced visualization of
coronary arteries in MSCT data. The extraction of
the heart and the masking of large cardiac cavities en-
ables the radiologist a clear view at the heart and at
the coronary artery tree in volume rendered CT data.
For drawing direct visual side-by-side comparisons
between representations of the coronary arteries ob-
tained by MSCT with that in conventionalangiograms
we present a novel automated technique based on the
generation of DRRs.
While (Lorenz et al., 2004) delineates the heart
from the outside, we extract the heart from within a
point in the middle of the heart. Thus, we need less
information about the position of the heart in the CT
data and therefore our approach is more flexibly appli-
cable (e.g., regarding the portion of the rib cage that is
included in the CT data). For simulating the coronary
angiography we proposed the generation of DRRs,
which is a common technique to obtain radiograph-
ical representations from tomographic datasets. The
advantage of our approach is that we get along with-
VISAPP 2008 - International Conference on Computer Vision Theory and Applications
294
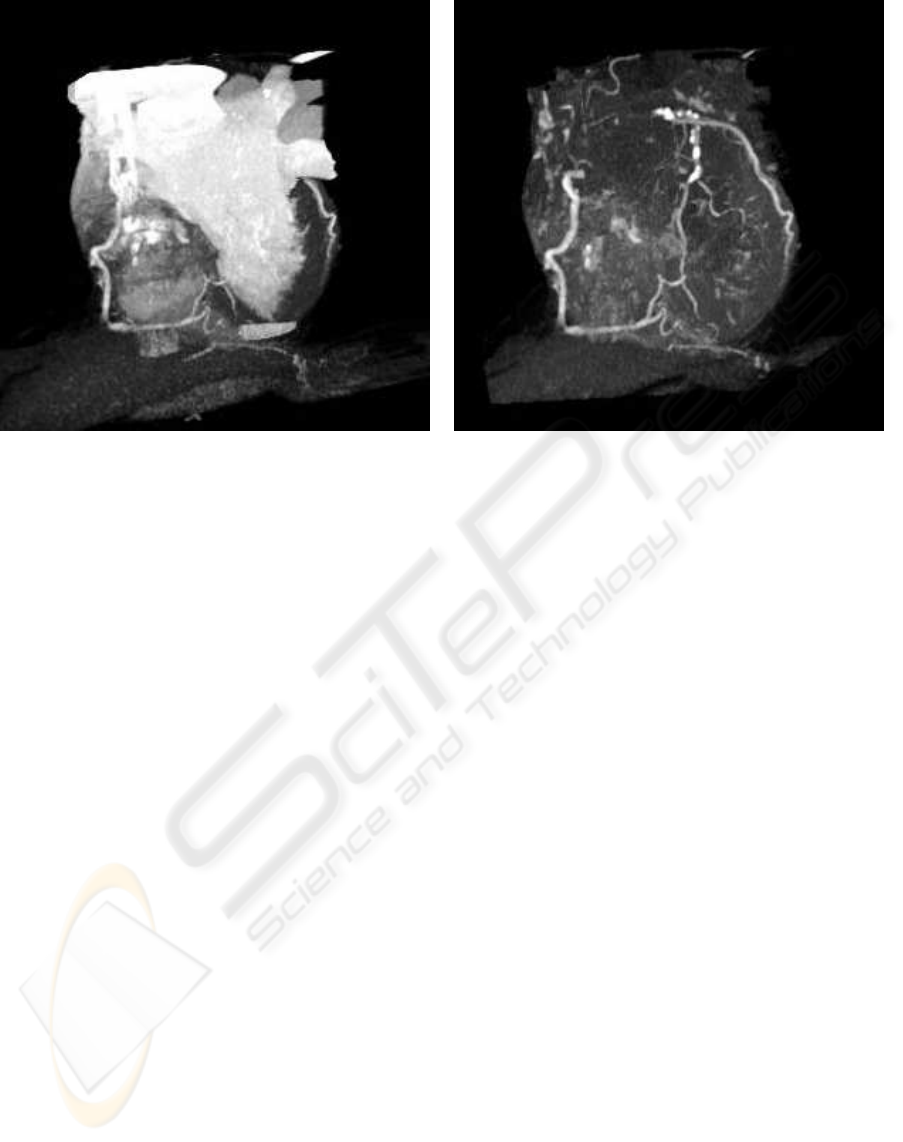
(a) (b)
Figure 5: Volume rendered cardiac CT data. (a) By eliminating non-cardiac structures only parts of the coronary artery tree
are visible. (b) By eliminating also large cardiac cavities the whole coronary artery tree is clearly visible.
out an explicit segmentation of the coronary artery
tree, neither in the CT data nor in the conventional
angiograms. At a single press of a button the radiolo-
gist obtains a representation of the coronary arteries
analogous to the representation in conventional an-
giograms. To our knowledge, no comparable auto-
mated approach has been published yet.
Since we opperate on the entire CT data the mask-
ing of cardiac cavities and the generation of DRRs de-
pends on the quality of the original CT data. For in-
stance, if the CT dataset was reconstructed at a point
in time, where the contrast medium was not opti-
mally distributed, a clear assigment of the contrast-
enhanced cardiac cavities to the two brightest gray
level values in the labeled CT data is difficult. To cir-
cumvent such problems the radiologist has the possi-
bility to adjust some parameters (e.g. the number of
thresholds).
Currently, we extend our approach by aligning the
generated DRR and the angiogram. By registrating
the two modalities it will be possible to highlite po-
sitions of potential pathologies (stenoses, calcifica-
tion) detected by quantitative 3D CT-analysis in the
angiograms. This would be a further step in enhanc-
ing the trust of the radiologist in the assessment of the
coronary arteries by MSCT.
An extended clinical evaluation together with our
clinical partners will be conducted in the near future.
ACKNOWLEDGEMENTS
We want to thank the Institute for Diagnostic and
Interventional Radiology of the Johann Wolfgang
Goethe University Frankfurt, Germany for provid-
ing us the cardiac CT datasets and conventional an-
giograms.
REFERENCES
Blondel, C., Malandain, G., Vaillant, R., and Ayache, N.
(2006). Reconstruction of coronary arteries from a
single rotational X-ray projection sequence. IEEE
Transactions on Medical Imaging, 25:653–663.
Großkopf, S. and Hildebrand, A. (1997). Three-
dimensional reconstruction of coronary arteries from
x-ray projections. In Lanzer, P., editor, Diagnostics of
Vascular Diseases. Principles and Technology, pages
307–314. Springer, Berlin; Heidelberg.
Hounsfield, G. N. (1992). Nobel Lecture, December 8,
1979. In Lindsten, J., editor, Nobel Lectures, Physi-
ology or Medicine 1971-1980, pages 568–586. World
Scientific Publishing Co., Singapore.
Lorenz, C., Lessick, J., Lavi, G., Blow, T., and Renisch, S.
(2004). Fast automatic delineation of cardiac volume
of interest in msct images. Proceedings of the SPIE,
Medical Imaging 2004: Image Processing, 5370:456–
466.
Otsu, N. (1979). A threshold selection method from gray
level histograms. IEEE Trans. Systems, Man and Cy-
bernetics, 9:62–66.
NOVEL TECHNIQUES FOR AUTOMATICALLY ENHANCED VISUALIZATION OF CORONARY ARTERIES IN
MSCT DATA AND FOR DRAWING DIRECT COMPARISONS TO CONVENTIONAL ANGIOGRAPHY
295
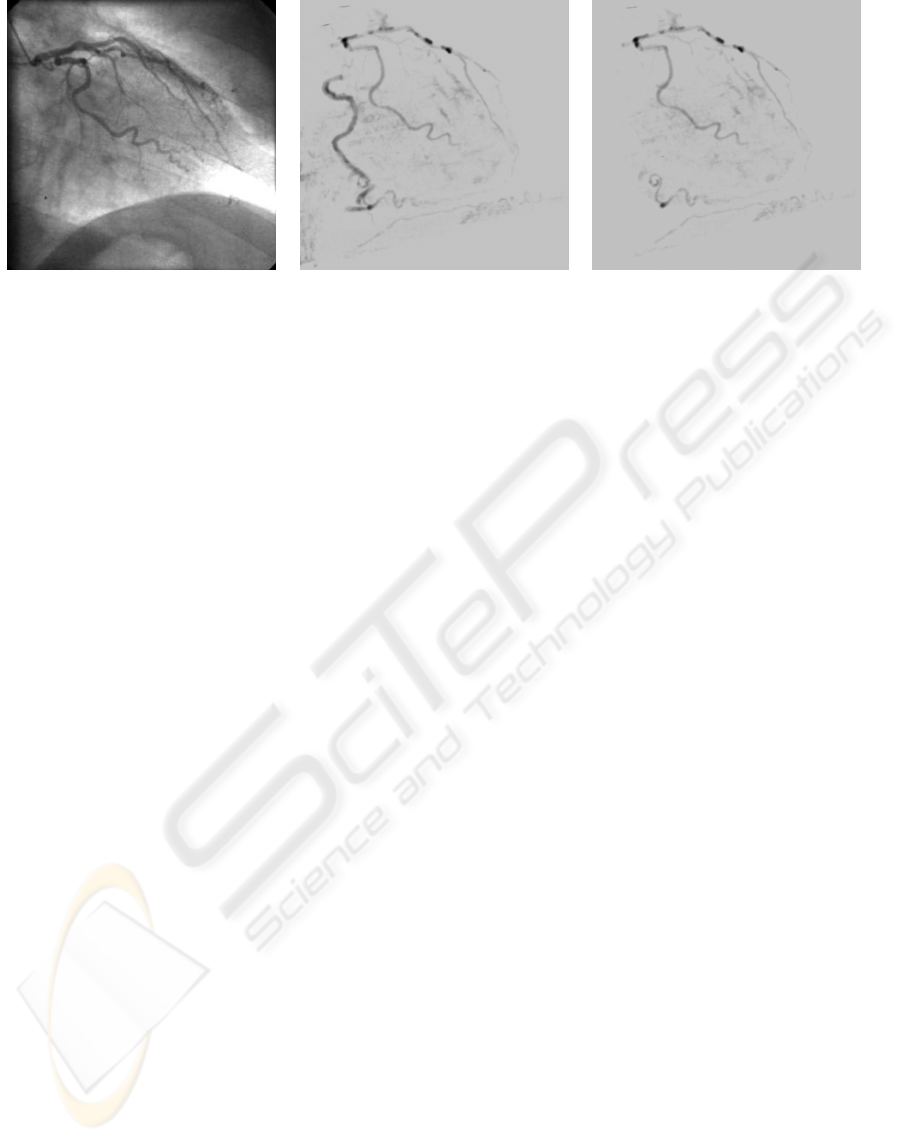
(a) (b) (c)
Figure 6: (a) Conventional angiogram of the left coronary artery branch (RAO 30.9 / CRAN 0.1) (b) Generated DRR from
the pre-processed CT data with projection parameters extracted from DICOM header file of (a). Both, left and right coronary
artery branches are visible. (c) Generated DRR from clipped pre-processed CT data.
Sang, N., Peng, W., Li, H., Zhang, Z., and Zhang, T. (2006).
3D reconstruction of the coronary tree from two x-ray
angiographic views. Proceedings of the SPIE, Med-
ical Imaging 2006: Image Processing, 6144:1591–
1598.
Schnapauff, D., D¨ubel, H., Scholze, J., Baumann, G.,
Hamm, B., and Dewey, M. (2007). Multislice
computed tomography: angiographic emulation ver-
sus standard assessment for detection of coronary
stenoses. European Radiology, 17:1858–1864.
Schroeder, S., Martin, K., and Lorensen, B. (2002). The
Visualization Toolkit. An Object-Oriented Approach to
3D Graphics. Kitware, Inc., 3rd edition.
von Berg, L. (2005). Fast automated object detection by re-
cursive casting of search rays. International Congress
Series, 1281:230–235.
VISAPP 2008 - International Conference on Computer Vision Theory and Applications
296
