
A NEW SET OF FEATURES FOR ROBUST CHANGE
DETECTION
José Sigut, Sid-Ahmed Ould Sidha, Juan Díaz and Carina González
Department of Systems Engineering and Computer Architecture, University of La Laguna, Tenerife, Spain
Keywords: Change detection, motion detection, image differencing, robustness, illumination changes.
Abstract: A new set of features for robust change detection is proposed. These features are obtained from a
transformation of the thresholded intensity difference image. Their performance is tested on two video
sequences acquired in a human-machine interaction scenario under very different illumination conditions.
Several performance measures are computed and a comparison with other well known classical change
detection methods is done. The performed experiments show the effectiveness and robustness of our
proposal.
1 INTRODUCTION
Detecting regions of change in images of the same
scene taken at different times is of widespread
interest due to a large number of applications in
diverse disciplines. Common applications of image
differencing include object tracking, intruder
surveillance systems, vehicle surveillance systems
and interframe data compression (Radke et al, 2005).
Due to its simplicity, image differencing has become
a very popular method for change detection. It only
requires calculating the absolute values of the
difference between the corresponding pixels in the
two frames considered. In the context of surveillance
applications, each frame is usually compared against
a reference or background model (Cheung and
Kamath, 2004), (Migliore et al, 2006). Large values
in the difference map indicate regions of change.
The crucial point here is the determination of the
optimal decision thresholds allowing for minimal
error probabilities and thus guaranteeing results
which are robust against noise changes over time,
e.g. due to changes in illumination conditions. This
indicates that in general threshold values should be
calculated dynamically based on the image content
and that empirically selecting a value is not
appropriate for most applications. Rosin, (Rosin,
2002), (Rosin and Ioannidis, 2003) surveyed and
reported experiments on many different criteria for
choosing the decision threshold.
The decision rule in many change detection
algorithms is cast as a statistical hypothesis testing.
The decision as to whether or not a change has
occurred at a given pixel corresponds to choosing
one of two hypotheses: the null hypothesis
0
H or
the alternative hypothesis
1
H , corresponding to no-
change and change decisions respectively.
Characterizing the null hypothesis is usually much
easier, since in the absence of any change, the
difference between image intensities can be assumed
to be due to noise alone. A significance test on the
difference image can be performed to assess how
well the null hypothesis describes the observations,
and this hypothesis is correspondingly accepted or
rejected. Modelling the background noise in static
applications is straightforward since any required
estimation can be done off-line for the used camera
system. However, a real time sequence is much
more challenging since noise features may change
over time and noise estimation must be done on-line
from unchanged regions which are not known a
priori (Thoma and Bierling, 1989). Aach et al (Aach
et al, 1993), (Aach et al, 2001) characterized the
noise in moving video as zero-mean Gaussian
random variables. The variances for the noise were
estimated from regions with very small intensity
differences. Bruzzone and Prieto (Bruzzone and
Prieto, 2000) noted that while the variances
estimated this way may serve as good initial guesses,
using them in a decision rule may result in a false
alarm rate different from the desired value.
In this paper, background noise is modelled by
using a new set of features as an alternative to the
usual intensity differences. We will show the
robustness of this approach to changes in the
illumination conditions. Section 2 of this paper
592
Sigut J., Ould Sidha S., Díaz J. and González C. (2008).
A NEW SET OF FEATURES FOR ROBUST CHANGE DETECTION.
In Proceedings of the Third International Conference on Computer Vision Theory and Applications, pages 592-596
DOI: 10.5220/0001080205920596
Copyright
c
SciTePress
explains the feature extraction procedure. In section
3, the experiments which have been carried out are
described and section 4 is devoted to the
conclusions.
2 FEATURE EXTRACTION
METHOD
The first step of the feature extraction method
consists of thresholding the absolute value of the
difference image
() () ()
xIxIxD
12
−
=
with the
lowest possible value, i.e., zero, as indicated in (1).
()
(
)
⎭
⎬
⎫
⎩
⎨
⎧
>
=
otherwise
xDif
xB
,0
0,1
(1)
An example of the resulting binary image for
the difference of two frames from a well known
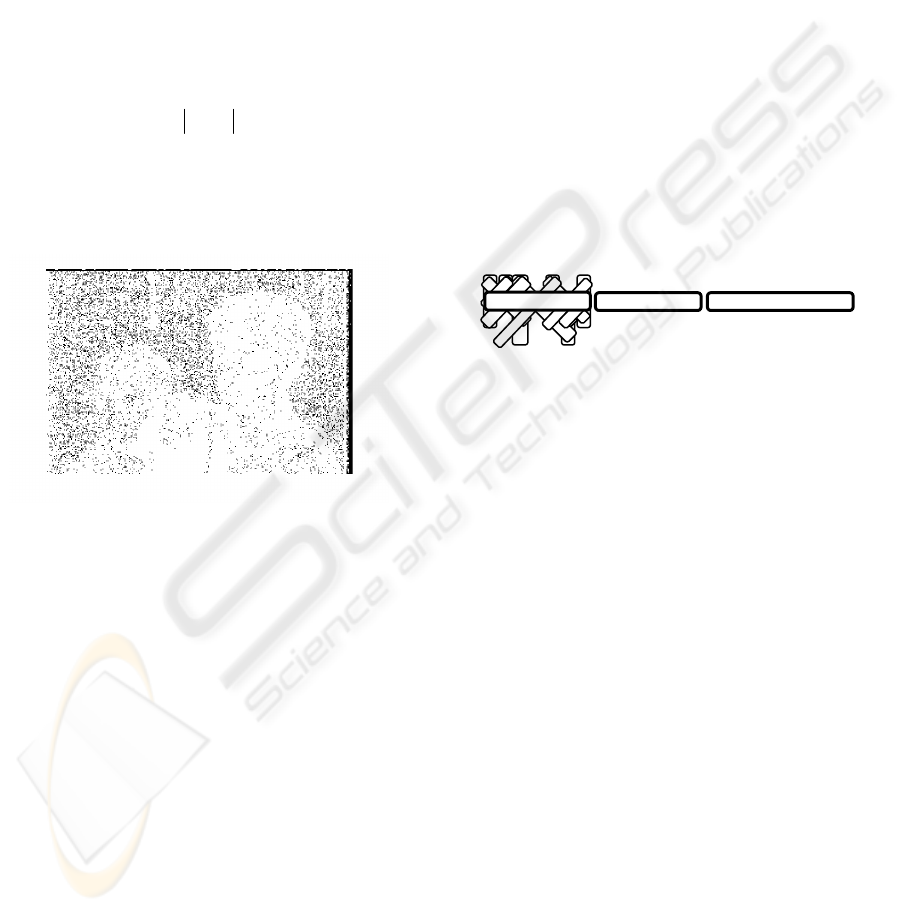
video sequence is shown in figure 1.
Figure 1: Binarized difference image for two frames of the
mom and daughter image sequence.
It is clear that the density of “black points” in
the unchanged parts of the image is higher than in
the regions of change. It is precisely these
differences in density what we intend to capture. The
simplest approach to this issue would probably be to
use a sliding window over the difference image and
assign the number of “black points” contained in the
window to the center pixel. However, density
measured in such a way is highly dependent on the
size and shape of the selected window which is not
appropriate. For this reason, an alternative set of
features is proposed.
These features are obtained from the
transformation of the binarized difference image in
two stages. In the first stage, unidimensional
connected components in the binary image are
computed. For this purpose, the four main
directions: horizontal, vertical, diagonal and inverse
diagonal are considered. This transformation assigns
each pixel the area of the corresponding connected
component it belongs to. In this way, four different
transformation matrices are obtained. It is clear that
it has no sense to use 4- or 8- bidimensional
connectivity since what it would probably be
obtained is just one connected component which is
completely useless in this case. Figure 2 shows a
simple example of a binary matrix and the result of
the transformation for the horizontal direction.
In the second stage of the feature calculation, a
new transformation is performed. This time, each
pixel belonging to a connected component computed
in a certain direction is assigned the area contained
in the intersection of this connected component with
the connected components in the remaining
directions. Again, four new matrices are obtained.
The example in figure 2 shows the areas obtained
from the intersection with the horizontal connected
components. The four density measures for each
pixel are then obtained from the values assigned to
the pixel as a result of this final transformation.
⎥
⎥
⎥
⎥
⎥
⎥
⎥
⎥
⎥
⎦
⎤
⎢
⎢
⎢
⎢
⎢
⎢
⎢
⎢
⎢
⎣
⎡
0000011
0011101
0000000
0100110
1110101
1111111
1010111
⎥
⎥
⎥
⎥
⎥
⎥
⎥
⎥
⎥
⎦
⎤
⎢
⎢
⎢
⎢
⎢
⎢
⎢
⎢
⎢
⎣
⎡
0000022
0033301
0000000
0100220
3330101
7777777
1010333
⎥
⎥
⎥
⎥
⎥
⎥
⎥
⎥
⎥
⎦
⎤
⎢
⎢
⎢
⎢
⎢
⎢
⎢
⎢
⎢
⎣
⎡
0000044
0044403
0000000
0700660
1111110905
20202020202020
5080121212
(a) (b) (c)
Figure 2: Example of transformations to obtain the
proposed features. (a) Binary matrix, (b) result of the first
transformation, (c) result of the second and final
transformation.
3 EXPERIMENTAL RESULTS
In order to demonstrate the effectiveness and
robustness of the proposed set of features in the
detection of changes in images, two video sequences
with different illumination conditions were tested.
The image sequences correspond to a head and
shoulders scene in a human-machine interaction
scenario and were acquired under normal and low
illumination conditions in an indoor setting. An
image resolution of 720*576 pixels was used.
For the purpose of comparison, some classical
change detection techniques were also tried. Since
interesting changes are often associated with
localized groups of pixels, it is common for the
change decision at a given pixel to be based on a
small block of pixels in its neighbourhood. Sliding
windows of sizes 1*1 (the pixel itself), 3*3 and 5*5
pixels were used over the intensity difference image
to give ordered sets of 1, 9 and 25 features,
A NEW SET OF FEATURES FOR ROBUST CHANGE DETECTION
593
respectively. As indicated in Aach et al (Aach et al,
1993), a window size between 3 and 5 pixels is an
acceptable choice in most change detection
applications.
In all cases, a single Gaussian was used to
model the noise in the unchanged regions, i.e.,
regions without motion. Samples from these regions
were used to estimate the parameters of a
Mahalanobis matrix. By setting different thresholds
on the Mahalanobis distance
()
xD
M
calculated as
in (2), the ROC curves for normal and low light
conditions were obtained.
()()()
μμ
−Σ−=
−
xxxD
T
M
1
(2)
Where
μ
is the mean vector and
Σ
is the
covariance matrix.
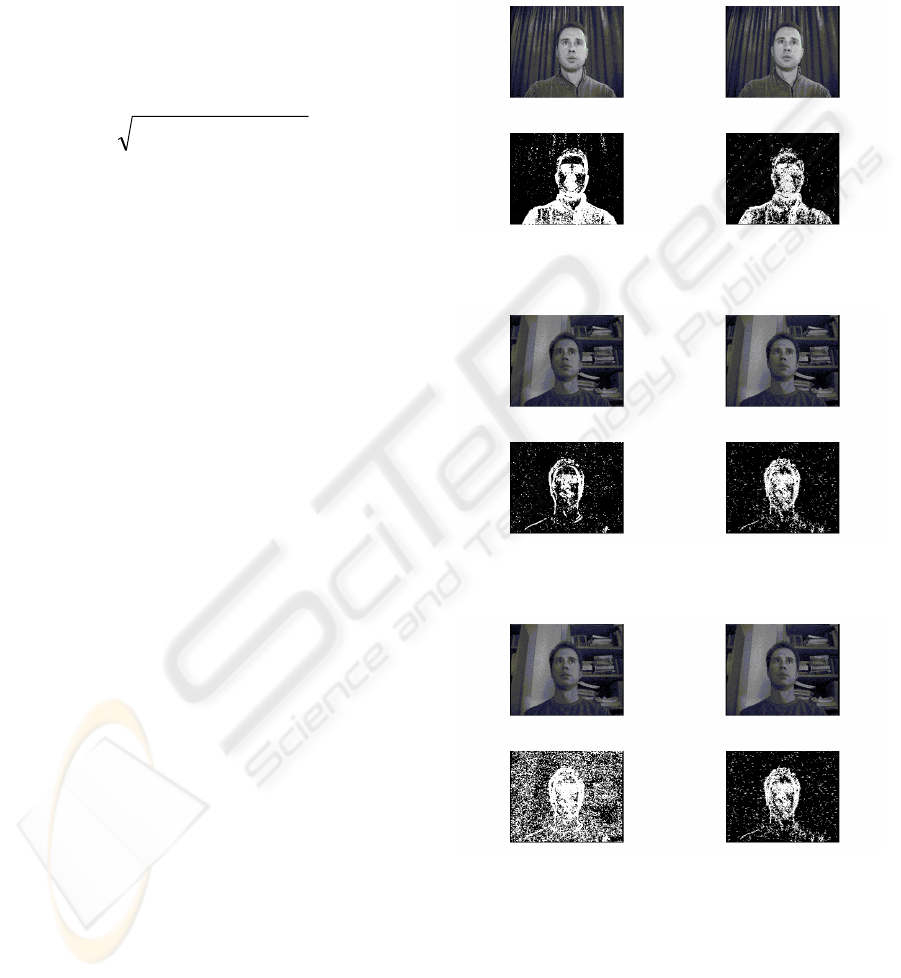
Three different experiments were performed.
A first experiment consisted of testing change
detection in several frames of the video sequence
acquired under normal illumination conditions. The
parameters of the Mahalanobis matrix were
estimated by using samples of noise from this video
sequence and the threshold was set by choosing the
“corner” of the corresponding ROC curve as the
operating point. Figure 3 shows the change masks
resulting from the detection procedure by using the
5*5 sliding window and the proposed set of features.
It can be seen that the result provided by the 5*5
window is slightly better than the one provided by
our method.
A second experiment consisted of testing
change detection in several frames of a video
sequence acquired under poor illumination
conditions. The parameters of the Mahalanobis
matrix were estimated by using samples of noise
from this video sequence and the threshold was also
set by choosing the “corner” of the corresponding
ROC curve as the operating point. Figure 4 shows
the change masks resulting from the detection
procedure by using the 5*5 sliding window and the
proposed set of features. In this case, the result
provided by our features slightly outperform the one
obtained by using the 5*5 window.
A third experiment consisted of testing change
detection again in several frames of a video
sequence acquired under poor illumination
conditions. However, this time, the parameters of the
Mahalanobis matrix were estimated by using
samples of noise from the video sequence acquired
under normal illumination conditions. The threshold
was also set by choosing the operating point
corresponding to illumination with normal light. Our
purpose was to test the influence of the training set
in the performance of the change detection method.
Figure 5 depicts the masks obtained for the 5*5
sliding window and our features. While the
performance of the proposed features does not seem
to be affected by the change in the training
conditions, it is clear that the results obtained with
the 5*5 window are very different and much worse
than in the second experiment.
Figure 3: Change masks obtained for normal illumination
with the 5*5 sliding window (left) and our method (right).
Figure 4: Change masks obtained for poor illumination
with the 5*5 sliding window (left) and our method (right).
Figure 5: Change masks for poor illumination and training
samples from normal illumination with the 5*5 sliding
window (left) and our method (right).
In order to confirm these observations, a more
quantitative analysis was carried out.
The results of the low level pixel based
comparison between the hand-labelled ground truth
and the resulting image for different frames of the
two sequences were based on the following values:
VISAPP 2008 - International Conference on Computer Vision Theory and Applications
594
True positives (TP): number of change pixels
correctly detected.
False positives (FP): number of no-change
pixels incorrectly flagged as change by the
algorithm.
True negatives (TN): number of no-change
pixels correctly detected.
False negatives (FN): number of change pixels
incorrectly flagged as no-change by the algorithm.
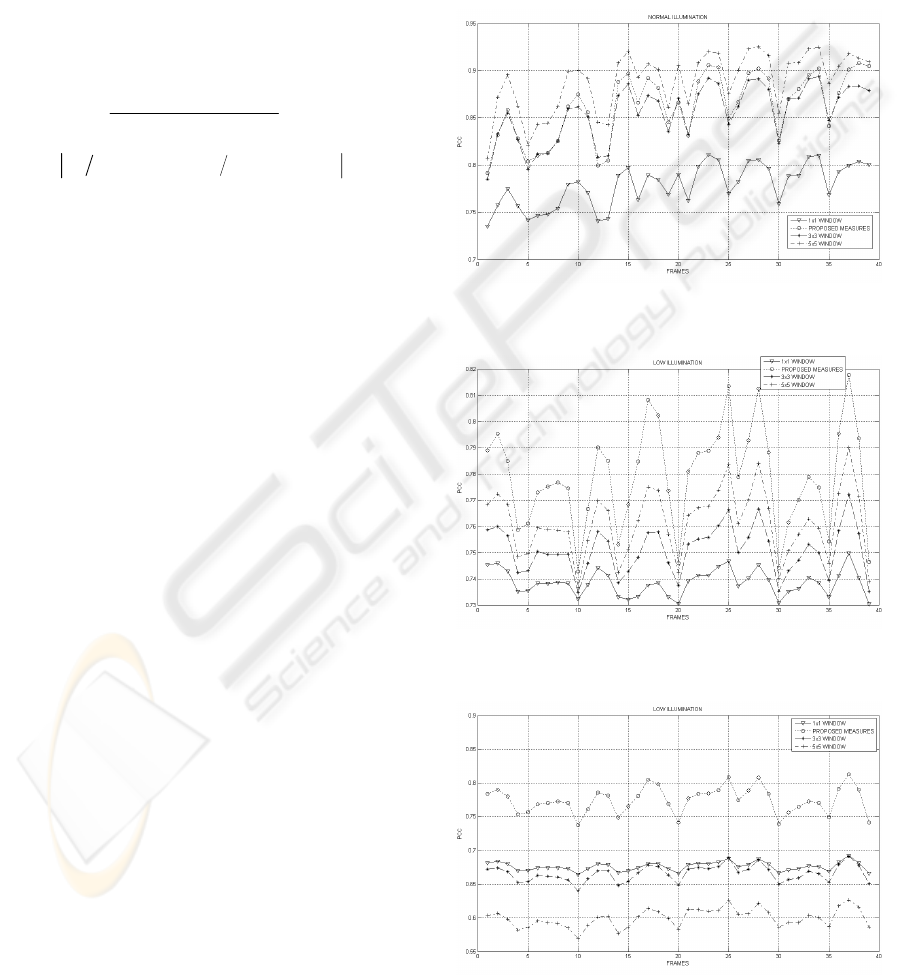
From these four quantities, the two following
performance measures were used as suggested by
Rosin (Rosin and Ioannidis, 2003):
()
()
FNTNFPTP
TNTP
PCC
+++
+
=
(3)
()( )
1−+++= FNTNTNFPTPTPYC
(4)
The well known PCC coefficient is the most
obvious approach to combine all four values and
also the usual way to assess a classifier’s
performance. However, it tends to give misleading
estimates when the amount of change is small
compared to the overall image. The Yule coefficient
YC (Sneath and Sokal, 1973) tries to overcome this
problem by minimising the effect of the expected
large volume of true negatives.
Figures 6, 7, 8, 9, 10 and 11 show the values
obtained for these performance measures calculated
on a number of frames of both video sequences.
It can be concluded that the proposed method
exhibits a good behaviour as measured by all the
coefficients and it is just slightly worse than the 5*5
sliding window method under normal light
conditions. Above all, its performance remains
nearly completely invariant against changes in the
training set as opposite to what happens with the
remaining techniques. This is important since it
suggests that in a real time application, noise
modelling could take place off-line without the need
to be updated to changing illumination conditions
which may be a difficult task and provide bad
estimations as it was already mentioned in the
introduction.
4 CONCLUSIONS
A new set of robust and effective features for change
detection in sequences of images has been proposed.
The features are obtained from a transformation of
the thresholded intensity difference image. Several
experiments under two different illumination
conditions have been carried out. A qualitative and
quantitative analysis has been performed and some
well known change detection techniques have been
tried for the purpose of comparison. The results
indicate that the proposed features perform well
when compared with other classical change
detection methods and what it is very important, this
performance remains invariant against changes in
the training conditions so that noise modelling could
be done off-line which may be very useful for real
time applications.
Figure 6: PCC coefficients for normal illumination
conditions and training samples from normal illumination.
Figure 7: PCC coefficients for poor illumination
conditions and training samples from poor illumination.
Figure 8: PCC coefficients for poor illumination
conditions and training samples from normal illumination.
A NEW SET OF FEATURES FOR ROBUST CHANGE DETECTION
595
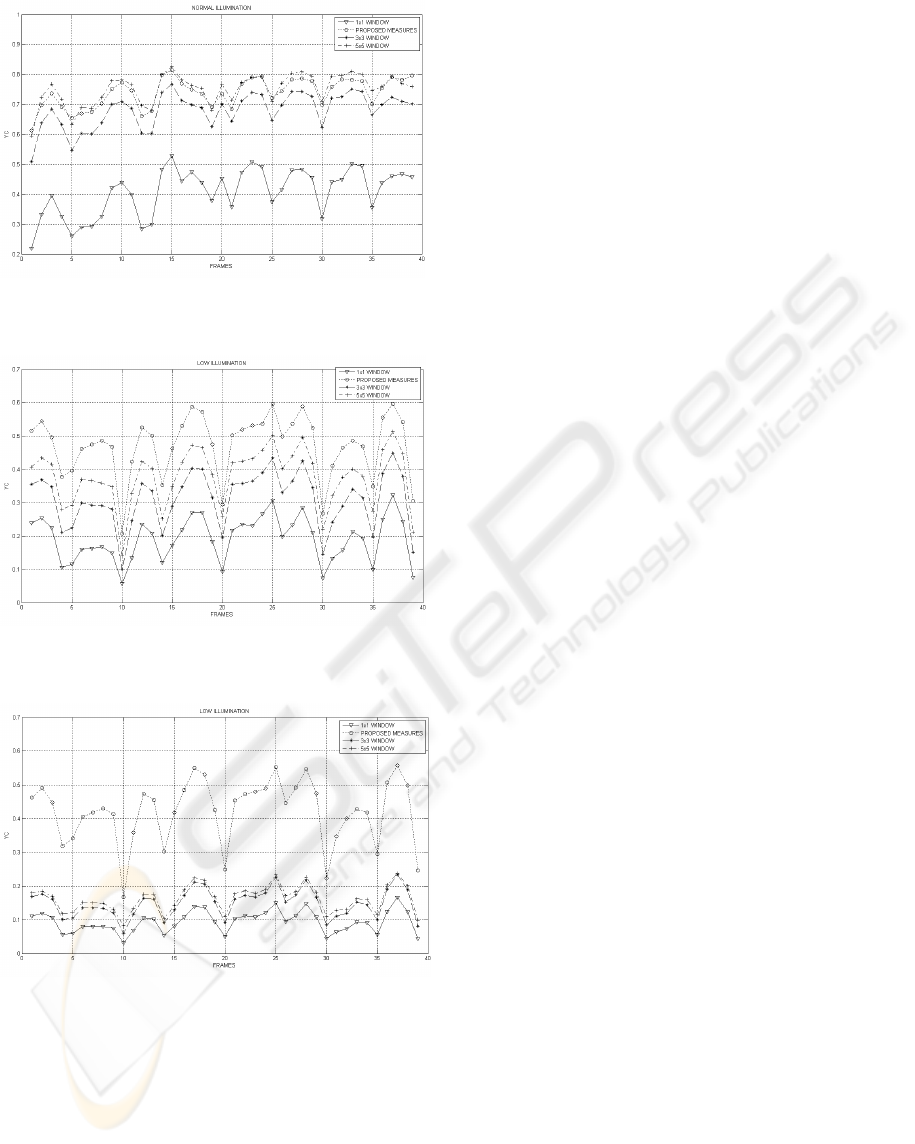
Figure 9: YC coefficients for normal illumination
conditions and training samples from normal illumination.
Figure 10: YC coefficients for poor illumination
conditions and training samples from poor illumination.
Figure 11: YC coefficients for poor illumination
conditions and training samples from normal illumination.
REFERENCES
Aach, T., Kaup, A., Mester, R., 1993. Statistical model-
based change detection in moving video. In Signal
Processing, Vol. 31.
Aach, T., Dümbgen, L., Mestere, R., Toth, D., 2001.
Bayesian Illumination-Invariant Motion Detection. In
Proceedings of the IEEE International Conference on
Image Processing, Vol.III.
Bruzzone, L., Pietro, D.F., 2002. An adaptive
semiparametric and context-based approach to
unsupervised change detection in multitemporal
remote-sensing images. In IEEE Transactions on
Image Processing, Vol. 11, No. 4.
Cheung, S., Kamath, C., 2004. Robust techniques for
background subtraction in urban traffic video. In
Proceedings of the SPIE. Visual Communications and
Image Processing, Vol. 5308.
Migliore, D.A., Matteucci, M., Naccari, M., 2006. A
revaluation of frame difference in fast and robust
motion detection. In Proceedings of the 4
th
ACM
International Workshop on Video Surveillance and
Sensor Networks.
Radke, R.J., Andra, S., Al-Kofahi, O., Roysam, B., 2005.
Image change detection algorithms: A systematic
survey. In IEEE Transactions on Image Processing,
Vol. 14, No. 3.
Rosin, P., 2002. Thresholding for change detection. In
Comput. Vision and Image Understanding, Vol. 86,
No. 2.
Rosin, P., Ioannidis, E., 2003. Evaluation of global image
thresholding for change detection. In Pattern
Recognition Letters, Vol. 24, No. 14.
Sneath, P., Sokal, R., 1973. Numerical Taxonomy. The
principle and practice of numerical classification.
W.H. Freeman.
Thoma, R., Bierling, M., 1989. Motion compensating
interpolation considering covered and uncovered
background. In Signal Processing. Image
Communication, Vol. 1, No 2.
VISAPP 2008 - International Conference on Computer Vision Theory and Applications
596
