
SOBI WITH ROBUST ORTHOGONALIZATION TO REMOVE
THE ARTEFACT STIMULUS IN EVOKED POTENTIAL
5Hz Current Sinusoidal Stimulus
Eduardo de Queiroz Braga, Carlos Julio Tierra-Criollo
Department of Electrical Engineering, UFMG,Av. Presidente Antônio Carlos 6627,Belo Horizonte,Brasil
Gilberto Mastrocola Manzano
Clinical Neurophysiology Laboratory , UNIFESP, São Paulo, Brasil
Keywords: SOBI-RO, somatosensory system, artefacts.
Abstract: The psychophysical evaluation of the sensibility of the thin and thick fibers with sinusoidal current
stimulation was proposed in the 80s. After that, researches observed that 5 Hz stimulus would be related to
the thin unmyelinated fiber. This work aims a quantitative analysis of the cerebral cortex response to 5 Hz
stimulus, through the identification of the latency components of the evoked potential (EP) that were
estimated by the coherent mean after remove the stimulus artefact by using the Independent Component
Analysis. Electroencephalography (EEG) signals were collected at Cz electrode (10-20 International
Standard System) of 5 volunteers. The EP estimated with 5 Hz stimulus using the Second Order Blind
Identification associated with Robust Orthogonalization (SOBI-RO) associated with the coherent mean
presented the following components: N
1
= 104 ms (one volunteer), P
1
= 179 ms (four volunteers) and
N
2
= 234 ms (three volunteers), P
2
= 280 ms (three volunteers) and N
3
= 493 ms (all volunteers). The SOBI-
RO techniques can be a very useful tool in artefacts and noise reduction on the EP estimation.
1 INTRODUCTION
Our knowledge about the world is built over
different sensations. The perceptions begin at
receptors cells and are transmitted to the central
nervous system through primary afferents fibers .In
the somatic system, these fibers have different
diameters and transmit different sensations to the
spinal cord: thin fibers transmit pain and
temperature, and thick fibers transmit the sense of
touch. An instrument of psychophysical sensibility
evaluation, proposed in the 80’s, is based on the
principle that activation of different diameters fibers
depends on frequency of sinusoidal currents: 5 Hz to
non-myelinic fibers (Masson et al., 1989; Ro et al.,
1989), 250 Hz to thin myelinic fibers and 2 kHz to
thick myelinic fibers.
The evoked potential (EP) by electric stimulus
can be obtained using the coherent mean (
Misulis,
1994; Regan, 1989
). When a sinusoidal current of
5 Hz is used to stimulate, a strong level of artefact in
this frequency is collected in the EEG electrodes.
The 5 Hz artefact damage the EP and the extraction
of this artefact (synchronised to the stimulus) is very
difficult because of is into EP frequencies. In this
case, alternative tools can be used. In this context,
the use of statistics tools can help us. The Second
Order Blind Identification associated with Robust
Orthogonalization -SOBI-RO (Belouchrani et al.,
1997; Belouchrani and Cichocki, 2000) can be a
useful technique where the stimulus artefact is
presented in the same frequency band of the EP. It
can be applied in EEG electrodes that are spatially
located in the scalp where each electrode is
considered like a linear mixture of blind brain
sources.
In the present work, the SOBI-RO was used to
detect and remove independent components
associated with the artefact and rhythm that difficult
the analysis on Cz channel. The reconstructed
signals would present the epochs without the
artefacts, and then, the ERP could be better
identified using the coherent mean.
273
de Queiroz Braga E., Julio Tierra-Criollo C. and Mastrocola Manzano G. (2008).
SOBI WITH ROBUST ORTHOGONALIZATION TO REMOVE THE ARTEFACT STIMULUS IN EVOKED POTENTIAL - 5Hz Current Sinusoidal Stimulus.
In Proceedings of the First International Conference on Bio-inspired Systems and Signal Processing, pages 273-276
DOI: 10.5220/0001066702730276
Copyright
c
SciTePress

2 MATERIALS AND METHODS
The EEG signals were collected in 5 normal
volunteers with closed eyes, without neurological
disease or medication. The experimental protocol
was performed in the Clinical Neurophysiology
laboratory on UNIFESP and was approved by the
Local Ethic’s Committee. The electrodes of
stimulation (10mm diameter gold electrodes) were
placed in the medial and lateral surfaces of the distal
phalanx, of the second finger of the left hand with a
thin amount of conductive gel. The 5 Hz sinusoidal
current stimulus with twice the sensibility threshold
was applied by the Neurometer Current Perception
Threshold (CPT)-USA. The Electroencephalogram
(EEG) signals were collected in the Cz channel and
the reference was A1+A2 (connected ear). In
addition, the stimulus signals were collected on left
wristband (Pi). These signals were used for
synchronization of the epochs. Six sessions with one
hundred of epochs (20s each, followed by 10s
without stimulation) were recorded with a sample
rate of 500 Hz by the NeuroScan SymAmpsTM –
USA. In each epoch were extracted two seconds
before and six after the stimulus where it expects to
find the EP. The 100 epochs of 8 seconds were
applied in the SOBI-RO algorithm labelled ICALAB
2.5 for MATLAB (ICALAB 2004).
2.1 The SOBI-RO
The SOBI-RO (Second Order Blind Identification
with Robust Orthogonalization) is a statistic tool of
ICA (Independent Component Analysis). This tool
considers the measured signals like a linear
combination of unknown sources (Hyvrinen et al,
2001). In this context, the epochs x can be expressed
like:
)(...)()(
:
)(...)()(
)(...)()(
11
.
21212
11111
tsatsatx
tsatsatx
tsatsatx
nmnmm
nn
nn
++=
++=
+
+
=
(1)
Or can be represented as:
A.sx = (2)
Where X is the epochs collected in Cz channel
and synchronized whit the stimulus. A is an
unknown mixing matrix that make the data x a linear
combination of the unknown sources s.
A pre step in the ICA is the Whitening. It is used
to represent the data in a new space, where the
signals are decorrelated with exhaustion.
Belorachrin and Cichocki (2000) presented a robust
technique applied in the whitening process called
Robust Orthogonalization that can give us a better
estimation of the coefficients of the whitening
matrix W.
In the Robust Whitening, a set of covariance
matrices of x at different lags is used to estimate the
whitening matrix:
H
AARR )()]-(tE[x(t).x )(
S
*
x
τττ
==
(3)
Where τ=1,...,K
The method uses an optimization algorithm that
estimate a linear combination of evaluated
covariance’s matrices R
X
:
∑
=
=
K
X
1
)(
ˆ
τ
τ
τα
RC
(4)
The eigen value decomposition (EVD) of C is
performed:
T
CnC
diag UUC ],...,[
22
1
λλ
=
(5)
And the whitening matrix is:
T
Cn
diag UZ
1
1
],...,[
−
=
λλ
(6)
The whitened data z is expressed like:
xAWxWZ ..
=
=
.
(7)
W.A is a unitary matrix U. In this context, the
objective of SOBI is to discover this matrix U. For
this, a cost function called join diagonalyzer -JD
(Belouchrani et al., 1997) is used. For that, a set of
covariance matrices of the data z is taken at different
lags:
T
WRWR
XZ
ˆ
)(
ˆˆ
)(
ˆ
ττ
=
(8)
Using second order information for theses
matrices it is possible to find the matrix U by an
optimization method of search.
Then, the mixing matrix A and the sources can
be estimated by:
UWA
ˆˆ
ˆ
#
=
(9)
)(
ˆˆ
)(
ˆ
tt
H
xWUs =
(10)
BIOSIGNALS 2008 - International Conference on Bio-inspired Systems and Signal Processing
274
a
)
b)
a
)
b)
where # is a pseudo-inverse matrix and H is a
Hermitian matrix.
2.2 Application of SOBI-RO
After the SOBI-RO detection, the independent
components passed by a visual inspection, and the
components related with the 5Hz stimulus were
deselected. The new epochs were reconstructed and
the coherent mean applied. But in this average, the
alpha rhythm was strongly present. Thus, in a
second approach, the SOBI-RO was applied to
remove frequency components of 8-10Hz that can be
associated with spontaneous EEG.
3 RESULTS
The EP for volunteer #1, obtained with the original
EEG signal at Cz channel (Figure 1a), presents high
level of the 5 Hz artefact that difficult the analysis.
After removing this 5 Hz artefact with SOBI-RO,
the EP can be seen most clearly in the Figure 1b.
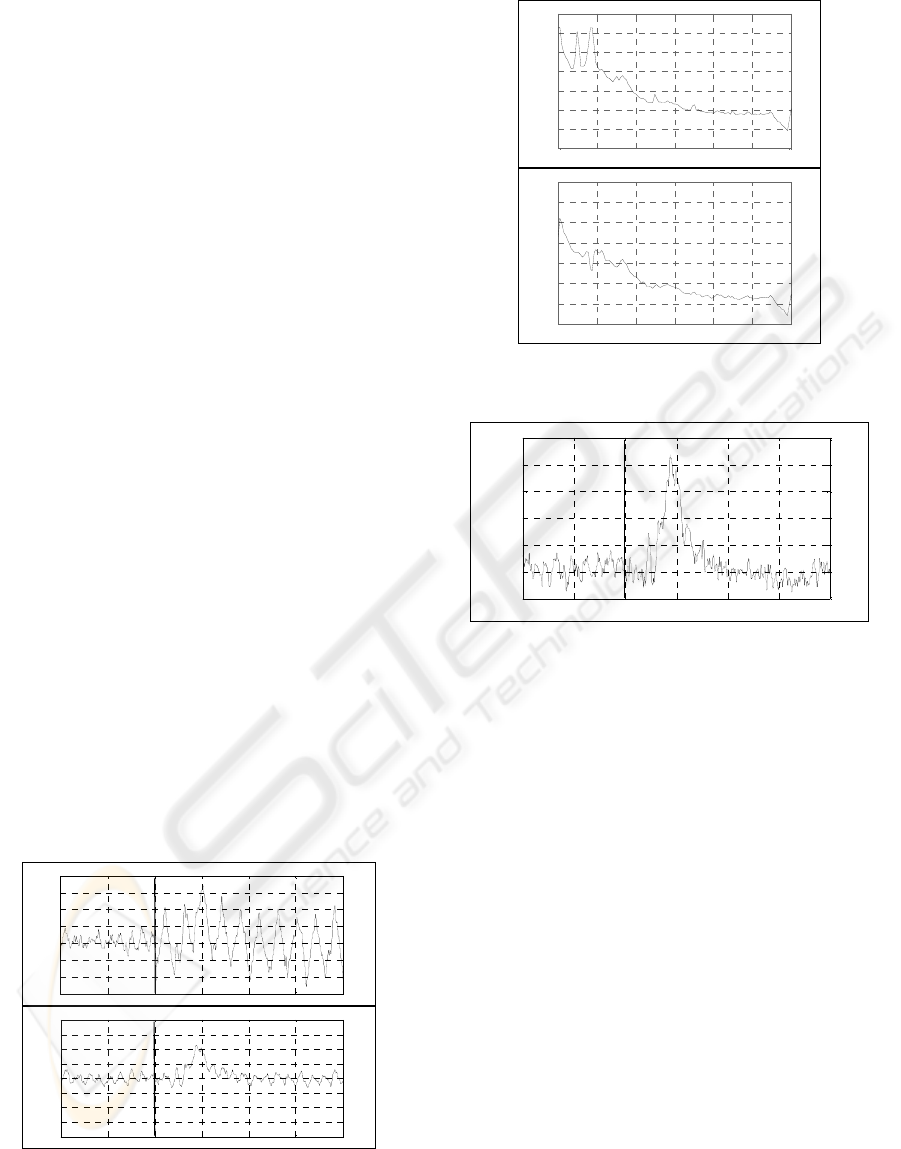
The power spectral density (PSD) shows the
attenuation of the 5 Hz frequency and odd
harmonics of 5 Hz (Figure 2).
A rhythm into 8-10Hz frequencies is also
presented, but before and after stimulation (Figure
1.b). The new EP shows the attenuation of this band
(Figure 2a and 2b). The components identified in
this EP (Figure 3, Table 1) were: P
1
= 188 ms,
N
1
=234 ms, P
2
= 268 ms and N
2
= 441 ms. The
grand-average of the five volunteers EP’s presented
components at N
1
= 109 ms, P
1
= 200 ms,
N
2
= 230 ms, P
2
= 279 ms and N
3
= 441 ms
(Table 1).
-1 -0.5 0 0.5 1 1.5 2
-3
-2
-1
0
1
2
3
4
Coherent Mean with 5Hz artefact - Volunteer #1
(
s
)
(uV)
-1 -0.5 0 0.5 1 1.5 2
-4
-3
-2
-1
0
1
2
3
4
(uV)
(
s
)
Coherent Mean after removing 5Hz artefac t - Volunt eer #1
Figure 1: EP of Cz channel (volunteer #1), (a) before and
(b) after SOBI-RO removing 5Hz component. Time 0 s
represents the beginning of the stimulation.
0 0.01 0.02 0.03 0.04 0.05 0.06
-15
-10
-5
0
5
10
15
20
Frequency ( kHz)
Power / fr equ enc y ( dB/ Hz)
Power Spec tral Densi ty Estim ate via Welch before S OBI
0 0.01 0.02 0.03 0.04 0.05 0.06
-15
-10
-5
0
5
10
15
20
Frequency ( kHz)
Power /fr equenc y (dB/ Hz)
Power Spectral Density Estimat e via Welc h after SOBI
Figure 2: PSD of EEG signals (volunteer #1) (a) before
and (b) after SOBI-RO.
-1 -0.5 0 0.5 1 1.5 2
-0.5
0
0.5
1
1.5
2
2.5
Coherent Mean for Volunteer #1 after SOBI-RO
(s)
(uV)
Figure 3: The EP after removing the artefact and 8-10Hz
related IC’s.
4 DISCUSSIONS
During the process to remove the 5Hz artifact with
SOBI-RO, the IC that represents this frequency was
clearly identified and removed. We can see in the
PSD (Figure 2) that the 5Hz stimulus artifact and
odd harmonics were completely removed. This
shows that the SOBI-RO was efficient in this step.
However, on the process for identifying of IC’s
related to the 8-10Hz band (possibly, associated with
the spontaneous alpha rhythm during closed eyes)
was more difficult. For each volunteer, ten or more
IC’s related with this band were founded. Some IC’s
showed a variation of the amplitude with the
stimulus .This fact does doubtful their removals and
suggests the necessity of a better method of
detection based on the statistical information of the
IC’s. In this work, the procedure was repeated ten
times (using 70 epochs randomly selected each time)
for evaluating the experimenter bias (due the visual
selection of the IC’s). The results were similar in all
cases.
SOBI WITH ROBUST ORTHOGONALIZATION TO REMOVE THE ARTEFACT STIMULUS IN EVOKED
POTENTIAL - 5Hz Current Sinusoidal Stimulus
275

The EP identification was only possible after
SOBI-RO pre-processing. The N
1
component was
only identified in the EP of volunteer #2. This
component will be confirmed in future researches,
with more experiments. In the other hand, the
components P
1
, N
2
and P
2
were present in a great
number of volunteers. All volunteers presented the
N
3
component (between 441ms and 604 ms). The
grand average also shows the N
1
, P
1
, N
2
, P
1
e N
3
components (Table 1).
Table 1: Components of the EP of five volunteers and
Grand Average after applying SOBI-RO.
Volunteer
N
1
(ms)
P
1
(ms)
N
2
(ms)
P
2
(ms)
N
3
(ms)
#1 - 188 234 268 441
#2 104 206 - - 424
#3 - 139 237 283 562
#4 - 181 230 290 434
#5 - - - - 604
Mean 104 179 234 280 493
Standard deviation - 28 4 11 84
Grand Average
109 200 230 279 441
5 CONCLUSIONS
This work presented a useful application of SOBI-
RO with the objective of removing the 5 Hz
sinusoidal current artefact and spontaneous activity
in the 8-10 Hz band. The conventional filtering can
not remove theses frequency bands without remove
information of the EP.
Research with SOBI-RO can be very useful in
signals where the artefact stimulus frequency is in
the same band of the EP.
ACKNOWLEDGEMENTS
The author would like to thank to the FAPEMIG,
FAPESP, CNPq and CAPES by the financial
support.
REFERENCES
Belouchrani A., Cichocki A., 2000. Robust Whitening
Procedure in Blind Source Separation Context,
Electronics Letters, vol. 36, p. 2050-2051.
Belouchrani, A., Meraim, K.A., Cardoso, J.-F., and E.
Moulines, 1997. A blind source separation technique
using second order statistics, IEEE Trans. Signal
Processing, vol. 45, pp. 434-444.
Hyvrinen, A., Karhunen, J., Oja, E. 2001. Independent
Components Analysis, John Wiley & Sons Canada,
Ltd. 1
st
ed. Canada
ICALAB: free software. Version 2.2. Japan, RIKEN
Labs., 2004. Posted in:
<http://www.bsp.brain.riken.jp/ICALAB/>. Access in
July, 10, 2006.
Masson, E.A., Veves, A., Fernando, D., Boulton, A.J.M.
(1989), Current perception thresholds: anew, quick,
and reproducible method for the assessment of
peripheral neuropathy in diabetes mellitus,
Diabetologia, 32, p.724-728.
Misulis, K. E., 1994. Spellman’s Evoked Potential
Primer: visual, auditory, and somatosensory evoked
potentials in clinical diagnosis. Ed. Butterworth-
Heinemann, Boston.
Regan, D. 1989. Human Brain Electrophysiology: Evoked
Potentials and Evoked Magnetic Fields in Science and
Medicine. Ed. Elsevier, New York. P.48-57.
Ro, L., Chen, S., Tang, L., Hsu, W., Chang, H., Huang, C.
(1999), Current perception threshold testingin Fabry's
disease. Muscle & Nerve, 22, p. 1531-1537.
BIOSIGNALS 2008 - International Conference on Bio-inspired Systems and Signal Processing
276
