
A SUPERVISED LEARNING APPROACH BASED ON THE
CONTINUOUS WAVELET TRANSFORM FOR R SPIKE
DETECTION IN ECG
G. de Lannoy
1,2
, A. de Decker
1
and M. Verleysen
1
1
Machine Learning Group, Universit
´
e catholique de Louvain
pl. du Levant 3, 1348 Louvain-la-Neuve, Belgium
2
Departement of physiology and pharmacology, Universit
´
e catholique de Louvain
av. Hippocrate 54, 1200 Bruxelles, Belgium
Keywords:
Continuous wavelet transform, automatic ECG annotation, R spike detection, supervised learning.
Abstract:
One of the most important tasks in automatic annotation of the ECG is the detection of the R spike. The
wavelet transform is a widely used tool for R spike detection. The time-frequency decomposition is indeed
a powerful tool to analyze non-stationary signals. Still, current methods use consecutive wavelet scales in
an a priori restricted range and may therefore lack adaptivity. This paper introduces a supervised learning
algorithm which learns the optimal scales for each dataset using the annotations provided by physicians on a
small training set. For each record, this method allows a specific set of non consecutive scales to be selected,
based on the record characteristics. The selected scales are then used on the original long-term ECG signal
recording and a hard thresholding rule is applied on the derivative of the wavelet coefficients to label the R
spikes. This algorithm has been tested on the MIT-BIH arrhythmia database and obtains an average sensitivity
rate of 99.7% and average positive predictivity rate of 99.7%.
1 INTRODUCTION
In the framework of biomedical engineering, the anal-
ysis of the electrocardiogram (ECG) is one of the
most widely studied topics. The easy recording and
visual interpretation of the non-invasive electrocar-
diogram signal is a powerful way for medical pro-
fessionals to extract important information about the
clinical condition of their patients.
The ECG is a measure of the electrical activity as-
sociated with the heart. It is characterized by a time-
variant cyclic occurrence of patterns with different
frequency content (QRS complexes, P and T waves).
The P wave corresponds to the contraction of the atria,
the QRS complex to the contraction of the ventricles
and the T wave to their repolarization. Because the
ventricles contain more muscle mass than the atria,
the QRS complex is more intensive than the P wave.
The QRS wave is therefore the most representative
feature of the ECG. Furthermore, once the QRS com-
plex has been identified, other features of interest can
be more easily detected.
Analyzing ECGs for a long time can lead to errors
and misinterpretations. This is the reason why au-
tomatic feature extraction of the ECG signal can help
physicians in their diagnosis for early detection of car-
diac troubles. The feature extraction mainly consists
in the automatic annotation of the different waves in
the recording, the most important of them being the
QRS. One of the main application of the QRS detec-
tion is the heart rate variability (HRV) analysis (Task
Force of the European Society of Cardiology and The
North American Society of Pacing and Electrophysi-
ology, 1996). HRV measures have been proven suc-
cessful in diagnosing cardiac abnormalities and neu-
ropathies or evaluating the actions of the autonomic
nervous system on the heart (Acharya et al., 2006).
However, HRV measures heavily rely on the accuracy
of the QRS feature detection on the digitalized ECG
signal.
Automatic feature extraction and especially R
spike detection is thus a milestone for ECG analy-
sis. However, it is a difficult task in real situations:
(1) The physiological variations due to the patient and
its disease make the ECG a non-stationary signal. (2)
Other ECG components such as the P or T wave look-
ing like QRS complexes often lead to wrong detec-
tions. (3) There are many sources of noise that pol-
140
de Lannoy G., de Decker A. and Verleysen M. (2008).
A SUPERVISED LEARNING APPROACH BASED ON THE CONTINUOUS WAVELET TRANSFORM FOR R SPIKE DETECTION IN ECG.
In Proceedings of the First International Conference on Bio-inspired Systems and Signal Processing, pages 140-145
DOI: 10.5220/0001062501400145
Copyright
c
SciTePress

lute the ECG signal such as power line interferences,
muscular artifacts, poor electrode contacts and base-
line wanderings due to respiration. These three prob-
lems highly compromise the detection of R spikes.
The detection of QRS complexes in the ECG has
been conducted by many researchers in the past years.
However, none of the current algorithms are able to
automatically learn their parameters using pre-labeled
beats provided by physicians. The aim of this paper
is to introduce a new algorithm for R peak detection
that does not blindly detect beats but learns and prop-
agates the annotations provided by physicians on a
small portion of the signal, which is often wanted in
real situations. Our contribution consists in the de-
sign and experiment of a supervised learning algo-
rithm for an optimal and automatic signal decompo-
sition for further optimal R spike detection. The as-
sociated detection method by hard thresholding rule
is also presented. The algorithm does not require any
pre-processing of the signal and can also be adapted
for the detection of other features such as the P or T
wave.
The following of this paper is structured as fol-
lows. After this introduction, section 2 gives a brief
literature review about the state of the art on ECG
feature detection and especially the QRS detection.
Section 3 provides a summary of the theory about the
continuous wavelet transform used in this paper. Sec-
tion 4 introduces the methodology followed by the al-
gorithm and section 5 shows the experiments and re-
sults obtained on a real public database.
2 STATE OF THE ART
Due to the non-stationarity of the ECG signal, the
physiological conditions and the presence of many
artifacts, finding a robust and general algorithm for
ECG feature detection is a tough task. A lot of work
has been published in the literature about the detec-
tion of various interesting ECG features such as P
waves, QRS waves, T waves, QT intervals or abnor-
mal beats by numerous techniques (Addison, 2005;
Sahambi et al., 2000; Senhadji et al., 1995). This pa-
per focuses on R spike detection only.
For this purpose, several approaches using dif-
ferent signal processing methods have been reported
previously: template matching (Dobbs et al., 1984),
mathematical models (Pahlm and Sornmo, 1984), sig-
nal envelop (Nygards and Sornmo, 1983), matched
filters (Koeleman et al., 1985), ECG slope crite-
rion (Algra and Zeelenberg, 1987), dynamic time
warping (Vullings et al., 1998), syntactic methods
(Kohler et al., 2002), hidden Markov models (Clavier
et al., 2002), beat detection by neural networks
(Xue et al., 1992; Shyuand et al., 2004), adapta-
tive thresholding (Madeiro et al., 2007; Christov,
2004), time-frequency decompositions by wavelet
transforms (Addison, 2005), and geometrical ap-
proach (Surez et al., 2007).
Among all these methods, the time-frequency de-
compositions by wavelet transform (WT) seem the
most intuitive tool for ECG analysis. The WT is natu-
rally appropriate for analyzing non-stationary signals
because it allows precise time-frequency representa-
tion of the signal with a low computational complex-
ity. A lot of work has been published in past years
on the use of the WT for QRS detection. In 1995,
(Li et al., 1995) used an algorithm based on finding
the maxima larger than a threshold obtained from the
pre-processed initial beats. Later, (Kadambe et al.,
1999) produced a method allocating a R peak at a
point being the local maxima of several consecutive
dyadic wavelet scales. In both these methods, a post-
processing allowed to eliminate false R detections.
Based on these two publications, a lot of other re-
searches were published on the beat detection based
on the WT (Shyuand et al., 2004; Fard et al., 2007;
Martinez et al., 2004; Addison, 2005; Chen et al.,
2005; Chen et al., 2006).
The main problem of the WT is that one has to
choose the mother wavelet and the scales used to an-
alyze the signal on an empirical basis. While the
mother wavelet can easily be chosen based on its char-
acteristics and ressemblance with a QRS wave, the
ideal scale(s) at which the QRS are matched is harder
to guess a priori. Current algorithms blindly search
for QRS complexes in a limited number of consecu-
tive scales selected in a range of a priori fixed scales.
However, the shape of the QRS pattern can be varying
between patients but also with time. One or several
consecutive fixed wavelet scales may not be enough
to match all complexes at once in a dataset. In this
paper, we propose a new supervised learning algo-
rithm based on the continuous wavelet transform that
overcomes these issues. It only relies on the anno-
tations provided by physicians on a small portion of
the signal in order to select the optimal subset of non-
consecutive scales for each dataset.
3 THEORY OF THE
CONTINUOUS WAVELET
TRANSFORM
The continous wavelet transform (CWT) is a tool
which produces a time-frequency decomposition of a
A SUPERVISED LEARNING APPROACH BASED ON THE CONTINUOUS WAVELET TRANSFORM FOR R SPIKE
DETECTION IN ECG
141

signal x(t) by the convolution of this signal with a so-
called wavelet function.
A wavelet function ψ(t) is a function with several
properties. It must be a function of finite energy, that
is
E =
Z
+∞
−∞
|ψ(t)|
2
dt < ∞, (1)
and it must have a zero mean.
From a wavelet function, one can obtain a family
of time-scale waveforms by translation and scaling
ψ
a,b
(t) =
1
√
a
ψ
t −b
a
(2)
where a > 0 represents the scale factor, b the transla-
tion and a, b ∈ R. When a = 1 and b = 0, the wavelet
is called the mother wavelet.
The wavelet transform of a function x (t) ∈ L
2
(R)
is a projection of this function on the wavelet basis
{ψ
a,b
} :
T (a, b) =
Z
+∞
−∞
x(t)ψ
a,b
(t)dt. (3)
For each a, the wavelet coefficients T (a,b) are signals
(that depend on b) which represent the matching de-
gree between wavelet ψ
a,b
(t) and the analyzed func-
tion x(t).
The signal energy at a specific scale and position
can be calculated as
E(a, b) = |T (a, b)|
2
. (4)
The two-dimensional wavelet energy density function
is called the scalogram.
The CWT is a suitable tool for ECG analysis be-
cause of this time-frequency representation of the sig-
nal. With the multiscale feature of WTs, the QRS
complex can be distinguished from high P or T waves,
noise, baseline drift, and artifacts. The important
time aspect of the non-stationary ECG signal is kept.
Moreover, very efficient implementations of the al-
gorithm exist and a low computational complexity is
required, allowing real-time analysis. With the aim of
a QRS detection, an appropriate mother wavelet must
be chosen. It must match nicely with a QRS complex,
in order to emphasizes these complexes and to filter
the useless noise. For more details on the wavelet
transform and on the standard wavelet functions avail-
able, the interested reader can consult (Mallat, 1999;
Addison, 2005; Daubechies, 1992).
4 METHOD DESCRIPTION
4.1 General Description
The detection of R spikes is a tough task due to the
complexity of the ECG signal. The aim of the algo-
rithm introduced here is to automatically find the best
subset of wavelet scales for optimal R detection. For
each dataset, this subset is selected on a short train-
ing sample by a supervised learning procedure. The
CWT at the selected scales is then computed on the
complete dataset. Finally, R spikes are detected by a
hard thresholding rule on the selected wavelet coeffi-
cients.
4.2 Training
The algorithm uses a supervised learning approach: it
will use the labeled information that is provided and
learn the best way to adapt to the problem. Here, the
labeled information that is provided is the location of
the R peaks in a training dataset.
Each dataset consists in a long-term ECG signal
recording (for example 24 hours). With such long
recording, the problem is that a manual extraction of
the R peaks cannot be performed, as detailed in the In-
troduction. However, asking a specialist to annotate a
small part of the signal by indicating the R peaks is
perfectly feasible; this annotated part will consist in
labeled segments of one minute each, taken at ran-
dom locations over the entire dataset. Choosing ran-
dom locations along the signal is a way to obtain a
representative training set maximizing the probability
to include all types of beats contained in the record-
ings. The CWT is then computed on the training set
in a wide (therefore non restrictive) range of 50 fixed
scales defined as {s
i
}, 1 ≤i ≤50. The mother wavelet
ψ(t) that was used in our experiments is the mexican
hat wavelet, for its similarity with the regular mor-
phology of the QRS complex. It is defined as the
second derivative of the gaussian probability density
function:
ψ(t) = (1 −t
2
)e
t
2
2
. (5)
In order to select the appropriate scales among the
wide range of wavelet scales, one needs a criterion. A
natural criterion is the percentage of correct R peaks
detection on the annotated parts of the signal using the
coefficients of the wavelet transform at the trial scales
in the set {s
i
}. A stepwise forward method automat-
ically selects the best subset {a
k
} ⊂ {s
i
} of scales on
the basis of the detection rate. It involves starting with
an empty subset, trying out at each step the trial scales
one by one and including them to the model if the de-
tection rate is improved. The procedure stops when
no scale left in {s
i
} can improve the detection rate. In
addition, at each step, the scales previously selected
in {a
k
} are individually challenged: if their removal
does not decrease the detection rate, the scale is now
useless and therefore removed from the model.
BIOSIGNALS 2008 - International Conference on Bio-inspired Systems and Signal Processing
142
The set {a
k
} of scales coming from the selection
is thus made of the scales giving the best R detection
when combined together. The selected set of scales is
then used for R spike detection on the complete orig-
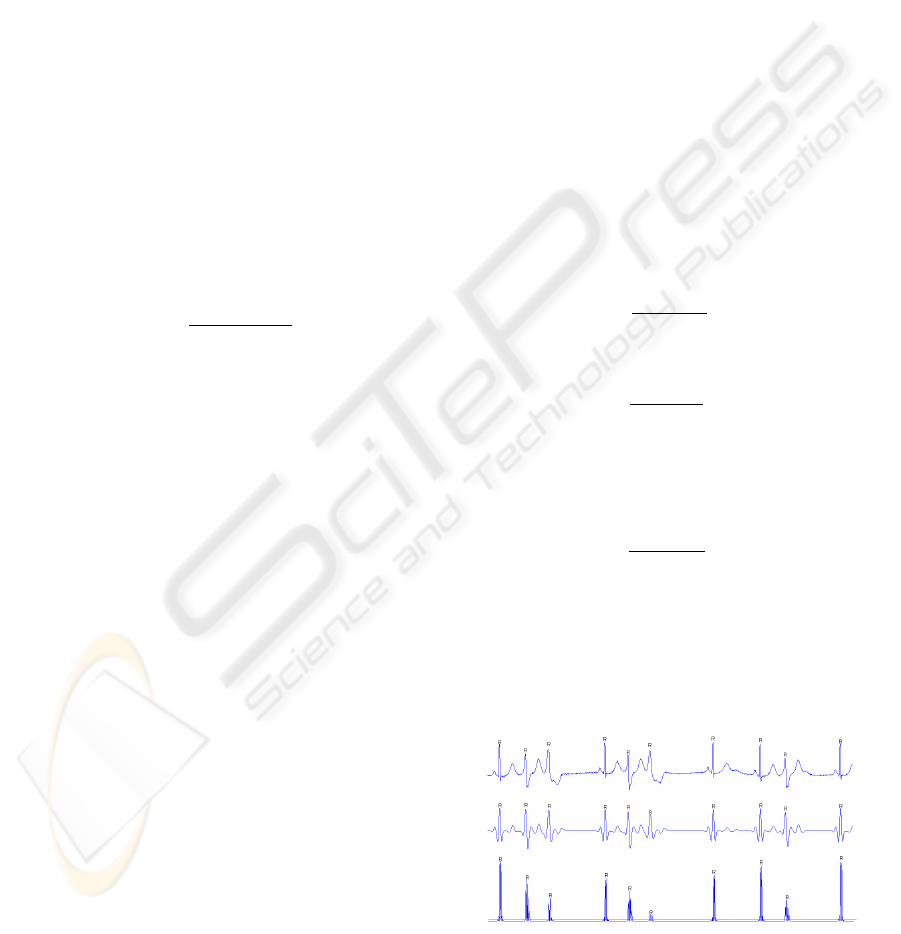
inal long-term recording. Figure 1 shows an original
ECG segment and the coefficients of the first selected
wavelet scale.
4.3 R Detection
The learning procedure extracted {a
k
} ⊂ {s
i
}, the
best subset of scales on the training set. Note that
the scales in the subset are not necessarily consecu-
tive, which means that different QRS shapes can be
matched at different scale levels. The CWT is com-
puted on the whole signal at the scales {a
k
}.
Because of the non-stationarity of the signal, a
moving window of 5 seconds length with an over-
lap of one second is used to cut T (a
k
, b) into J parts,
1 ≤ j ≤ J. For each a
k
and b
j
, the R spikes are de-
tected on T (a
k
, b
j
) by a hard thresholding rule, where
index b
j
scans the jth window. Let us define
D(a
k
, b
j
) =
d|T (a
k
, b
j
)|
2
db
j
2
. (6)
A threshold th(a
k
, j) is estimated as the mean of
D(a
k
, b
j
). As D(a
k
, b
j
) has sharp peaks in the slopes
of the QRS complexes, the intervals I(a
k
, j) satisfying
D(a
k
, b
j
) > th(a
k
, j) (7)
belong to QRS complexes. The R spikes are then
defined as the maxima of |T (a
k
, b
j
)|
2
in each of the
I(a
k
, j) intervals. All the R spikes obtained at each
scale k are then merged together.
4.4 Post-processing
A last step of post-processing makes sure that T waves
or Q and S spikes have not been wrongly labeled as a
R. If two or more R spikes were detected in a window
smaller than 250ms (two heartbeats cannot physiolog-
ically happen in less than 250ms (Christov, 2004)),
the algorithm keeps only the peak which has the high-
est value on the original ECG.
5 RESULTS AND VALIDATION
The learning of the model on the training set and the
assessment of performances must be done using an
annotated database. The public standard MIT-BIH ar-
rhythmia database (Goldberger et al., 2000) was used
in this work. It contains 48 half-hour recordings of
annotated ECG with a sampling rate of 360Hz and
11-bit resolution over a 10-mV range. The recorded
signals contain different wave types and only a ro-
bust algorithm can perform well on all datasets to-
gether. Some datasets include very few artifacts and
clear R peaks, but others make the detection of the
R spike more difficult because of (1) abnormal QRS
shapes or P and T waves, (2) low signal-to-noise ra-
tio, (3) heavy baseline drifts, (4) lots of non normal
beats such as premature ventricular contraction, left
bundle branch block beat, atrial premature contraction
etc... Among the 48 available datasets, the four ones
including paced beats were a priori rejected because
they consist in a special case. After visual inspection
of the data, datasets 207 and 208 were also rejected.
The reason is that a representative training set of five
times one minute would be hard to extract randomly
as several minutes of these two datasets contain only
non-labeled parts looking like a sinus wave.
The performances were assessed by evaluating
two parameters as suggested in (Kohler et al., 2002).
The sensitivity is measured as
T P
T P + FN
(8)
and the positive predictivity as
T P
T P + FP
, (9)
where TP is the number of true positive detections,
FN the number of false negatives and FP the number
of false positives. The error rate is also reported. It is
computed by
FN + FP
n
QRS
, (10)
where n
QRS
is the total number of QRS labeled in a
dataset. On the database, the algorithm obtains an av-
erage sensitivity rate of 99.7% and average positive
predictivity rate of 99.7%. The average error rate is
below one percent. To our knowledge, only three R
Figure 1: Example of an original ECG segment (upper plot),
the first selected wavelet scale (middle plot) and its squared
derivative (lower plot).
A SUPERVISED LEARNING APPROACH BASED ON THE CONTINUOUS WAVELET TRANSFORM FOR R SPIKE
DETECTION IN ECG
143

spike detectors based on WT reported in the literature
obtained comparable results with a sensitivity and a
positive predictivity of around 99.8% (Martinez et al.,
2004; Li et al., 1995; Chen et al., 1997). Our algo-
rithm achieves comparable performances without the
need for a more advanced post-processing stage such
as those used in these articles.
6 CONCLUSIONS
In this paper, a supervised learning algorithm for
the automatic detection of R peaks in ECG is in-
troduced. It uses the multiscale feature of the con-
tinuous wavelet transform (CWT) to emphasize the
QRS complex over high P or T waves, noise, base-
line drift and artifacts. The CWT keeps the important
time aspect of the non-stationary ECG signal. More-
over, very efficient implementations of the CWT exist
and a low computational complexity is required, al-
lowing real-time analysis. This algorithm learns and
propagates the annotations provided by a physician
on a small annotated segment. For this purpose, the
method selects the best subset of wavelet scales on a
representative training set by a stepwise forward pro-
cedure. The forward procedure allows to select scales
that are not necessarily consecutive and it does not
a priori restrict the range of computed scales on an
empirical basis. It allows a complete different set
of scales to be selected for each ECG signal, based
on its characteristics. The selected scales are then
used on the original long-term ECG signal recording
and a hard thresholding rule is applied on the deriva-
tive of the wavelet coefficients to label the R spikes.
The method is robust and does not require any pre-
processing stage. The selection procedure can be gen-
eralized in order to detect other ECG features such as
the P and T wave.
Experiments on the public annotated MIT-BIH
database lead to a sensitivity of 99.7% and a posi-
tive predictivity of 99.7% without the need of an ad-
vanced post-processing stage on the detected peaks.
To our knowledge, only three R spike detectors based
on WT reported in the literature obtained comparable
results, while requiring a more complex post process-
ing stage.
Further works will include: (1) The development
of a more advanced thresholding rule that takes the
peaks detected so far into account; (2) the use of
a more advanced post-processing stage to eliminate
wrong detections; (3) the design of an automatic se-
lection of the best mother wavelet by the same learn-
ing methodology; (4) the generalization of the method
for the detection of other ECG features such as P or T
wave.
ACKNOWLEDGEMENTS
This work was partly supported by the Bel-
gian “R
´
egion Wallonne” ADVENS convention 4994
project and by the Belgian “R
´
egion de Bruxelles-
Capitale” BEATS project.
REFERENCES
Acharya, U. R., Joseph, K. P., Kannathal, N., Lim, C., and
Suri, J. (2006). Heart rate variability: a review. Med-
ical and Biological Engineering and Computing, Nov
17.
Addison, P. D. (2005). Wavelet transform and the ecg: a
review. Physiological Measurement, 26:155–199.
Algra, A. and Zeelenberg, H. (1987). An algorithm for com-
puter measurement of qt intervals in the 24 h ecg. Pro-
ceedings of the IEEE Computer Society Press, page
1179.
Chen, S., Chen, H., and Chan, H. (1997). Dsp implementa-
tion of wavelet transform for real time ecg waveforms
detection and heart rate analysis. Computer Methods
and program in Biomedicine, 55(1):35–44.
Chen, S., Chen, H., and Chan, H. (2006). A real-time qrs
detection method based on moving-averaging incor-
porating with wavelet denoising. Comput Methods
Programs Biomed., 82(3):187–95.
Chen, Y., Yan, Z., and He, W. (2005). Detection of qrs-wave
in electrocardiogram: Based on kalman and wavelets.
Conf Proc IEEE Eng Med Biol Soc., 3:2758–60.
Christov, I. I. (2004). Real time electrocardiogram qrs de-
tection using combined adaptive threshold. BioMedi-
cal Engineering OnLine, 3(1):28.
Clavier, L., Boucher, J.-M., Lepage, R., Blanc, J.-J., and
Cornily, J.-C. (2002). Automatic p-wave analysis of
patients prone to atrial fibrillation. Med Biol Eng
Comp, 40:6371.
Daubechies, I. (1992). Ten Lectures on Wavelets (C B M S
- N S F Regional Conference Series in Applied Math-
ematics). Soc for Industrial & Applied Math.
Dobbs, S., Schmitt, N., and Ozemek, H. (1984). Qrs detec-
tion by template matching using real-time correlation
on a microcomputer. Journal of clinical engineering,
9(3):197–212.
Fard, P. J. M., Moradi, M., and Tajvidi, M. (2007). A novel
approach in r peak detection using hybrid complex
wavelet (hcw). International Journal of Cardiology,
In press(Available online 27 March 2007).
Goldberger, A., Amaral, L., Glass, L., Hausdorff, J., Ivanov,
P., Mark, R., Mietus, J., Moody, G., Peng, C.-K.,
and Stanley, H. (2000). PhysioBank, PhysioToolkit,
and PhysioNet: Components of a new research re-
source for complex physiologic signals. Circulation,
101(23):e215–e220.
BIOSIGNALS 2008 - International Conference on Bio-inspired Systems and Signal Processing
144

Kadambe, S., Murray, R., and Boudreaux-Bartels, G.
(1999). Wavelet transform-based qrs complex detec-
tor. IEEE Transactions on Biomedical Engineering,
46:838–48.
Koeleman, A., Ros, H., and van den Akker, T. (1985).
Beat-to-beat interval measurement in the electrocar-
diogram. Med Biol Eng Comp, 23:2139.
Kohler, B., Hennig, C., and Orglmeister, R. (2002). The
principles of software qrs detection. IEEE Eng Med
Biol Mag., 2(1):42–57.
Li, C., Zheng, C., and Tai, C. (1995). Detection of ecg
characteristic points using wavelet transform. IEEE
Trans.Biomed, 42(1):21–28.
Madeiro, J., Cortez, P., Oliveira, F., and Siqueira, R. (2007).
A new approach to qrs segmentation based on wavelet
bases and adaptive threshold technique. Medical En-
gineering and Physics, 29:2637.
Mallat, S. (1999). A Wavelet Tour of Signal Processing, Sec-
ond Edition (Wavelet Analysis and Its Applications).
IEEE press, San Diego. ISBN 978-0124666061.
Martinez, J., Almeida, R., Olmos, S., Rocha, A., and La-
guna, P. (2004). A wavelet-based ecg delineator: eval-
uation on standard databases. IEEE Transactions on
Biomedical Engineering, 51:570–81.
Nygards, M. and Sornmo, L. (1983). Delineation of the qrs
complex using the envelope of the ecg. Med Biol Eng
Comp, 21:53847.
Pahlm, O. and Sornmo, L. (1984). Software qrs detection in
ambulatory monitoringa review. Med Biol Eng Comp,
22:28997.
Sahambi, J., Tandon, S., and Bhatt, R. (2000). An auto-
mated approach to beat-by-beat qt-interval analysis.
IEEE Eng. Med. Biol. Mag., 19(3):97–101.
Senhadji, L., Carrault, G., Bellanger, J., and Passariello,
G. (1995). Comparing wavelet transforms for recog-
nizing cardiac patterns. IEEE Eng. Med. Biol. Mag.,
149(2):167–173.
Shyuand, L.-Y., Wu, Y.-H., and Hu, W. (2004). Using
wavelet transform and fuzzy neural network for vpc
detection from the holter ecg. IEEE Transactions on
Biomedical Engineering, 51:1269–73.
Surez, K. ., Silva, J., Berthoumieu, Y., Gomis, P., and Na-
jim, M. (2007). Ecg beat detection using a geometrical
matching approach. IEEE Transactions on Biomedi-
cal Engineering, 54(4):641–50.
Task Force of the European Society of Cardiology and The
North American Society of Pacing and Electrophys-
iology (1996). Heart-rate variability: Standards of
measurement, physiological interpretation, and clin-
ical use. Circulation, 93(5):1043–65.
Vullings, H., Verhaegen, M., and Verbruggen, H. (1998).
Automated ecg segmentation with dynamic time
warping. Proceedings of the 20th Annual Interna-
tional Conference on IEEE Engineering in Medicine
and Biology Society, page 1636.
Xue, X., Hu, Y., and Tompkins, W. (1992). Neural-
network-based adaptive matched filtering for qrs de-
tection. IEEE Transactions on Biomedical Engineer-
ing, 32(4):317–329.
A SUPERVISED LEARNING APPROACH BASED ON THE CONTINUOUS WAVELET TRANSFORM FOR R SPIKE
DETECTION IN ECG
145
