
A VISUAL INTERFACE BASED ON THE MVC PARADIGM
TO LOCATE PEOPLE
Francisco Javier Ferrández Pastor, Juan Manuel García Chamizo and Rafael Jesús Valdivieso Sarabia
Departamento Tecnología Informática y Computación, Universidad de Alicante
Carretera San Vicente del Raspeig s/n, Alicante, Spain
Keywords: Elderly care services, wearable devices, indoor location, multi-frequency techniques, model-view-
controller.
Abstract: Location and tracking of mobiles, i.e. people, vehicles and systems, where global positioning systems are
unable need the use of ad-hoc local techniques. There is a vast field of applications that include children and
elderly cares, location of specialists in hospitals and industry, security systems, etc. Our approach proposes
supervisory software and radio frequency data acquisition system to offer location and tracking services. In
this paper, we present a graphical interface for simulating, monitoring and managing what each scholar does
and where he is. The proposal is based on the model-view-controller paradigm and a Java implementation
has been developed.
1 INTRODUCTION
The developed societies are experiencing a
significant ageing. The Statistical Office of the
European Communities, EUROSTAT, states that
65th and older supposed 17 % of total population in
the European Union in 2005. Estimations are made
that 30 % will be reached at 2050 (EUROSTAT,
2006). This situation leaves us to contribute by mean
of technological proposals, to reduce the cost of the
services.
Our government is paying special attention to
dependent persons in the last years. They supposed 9
% of the spanish population in 1999 (INE, 1999).
The recent approval of the "Law of Promotion of the
Personal Autonomy and Attention to Persons in
Situation of Dependence" gives us the mark to
develop services for disabled persons. Those
services could require sanitary and welfare qualified
personnel or technological support, too.
Children up to 9 years were 9.39 % in 2002 and
9.85 % in 2007, showing a light increment. The
security of children is being one of the most relevant
objectives of his parents and the authorities. As a
consequence, children are using mobile
communications early.
Location systems can also be used in hospitals,
commercial or leisure centres, fairgrounds, as well
as to locate doctors in hospitals, workers in mines,
watchmen and so on.
The main objectives of this work are provide a
visual interface for simulating, monitoring and
managing computer utilities oriented to locate and
track people and mobile targets. That tool should be
friendly to satisfy monitoring requirement, precise to
support experimentation and powerful to configure
utilities in an easy way.
Following, second section describes generalities
of the location system, and an overview of more
known outdoor and indoor location systems is made.
In section three, we explain a module of utilities
oriented to scholars and screen captures are showed
to suggest the reader its potentialities. Conclusion
section indeed the main goals and related future
works.
2 LOCATION SYSTEM
The location system takes charge verifying the
position of each one of the persons to monitoring.
There develop services derived from this location
depending on the requirements of the place where
has been installed.
The location system can be used in centres
where the position of the persons should be known
in each time. This information could be useful to
increase the security of the hospitalized persons. It
could be used to improve response time of critical
services like hospital urgencies, also.
260
Javier Ferr
´
andez Pastor F., Manuel Garc
´
ıa Chamizo J. and Jes
´
us Valdivieso Sarabia R. (2008).
A VISUAL INTERFACE BASED ON THE MVC PARADIGM TO LOCATE PEOPLE.
In Proceedings of the First International Conference on Health Informatics, pages 260-265
Copyright
c
SciTePress
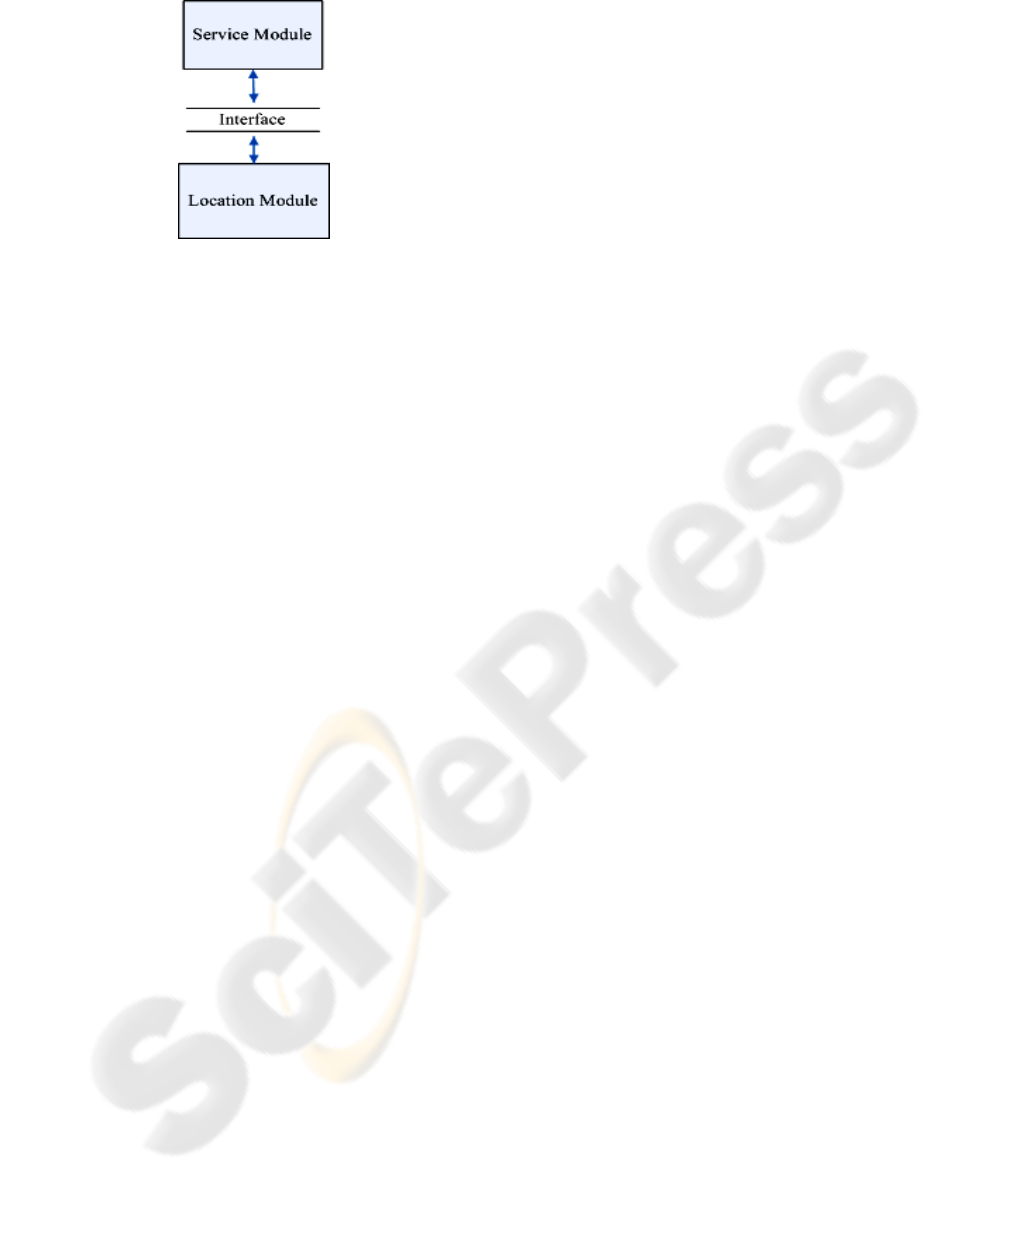
Figure 1: Basic scheme of the location system.
The structure of the location system is
determined by the functional organization that can
be observed in figure 1.
The location module takes charge to verify the
position of each one of persons. The other one,
Service Module, takes charge providing the services
derived from position. The independence between
modules allows us replace the location module by
future versions.
The location module takes charge determining
the real position of the transmitter respect of the
receiving antenna. This way, knowing the location
of the antenna, we manage the position of every
person. We must choose the place where persons are
going to take the transmitter. This is important,
because it could determine the success or failure of
the system in some environments. Nowadays there
are devices that are placed in the wrist or in the neck
like a hanger. Persons are conscious that they are
carrying it. To avoid this situation, we think that the
transmitter should be placed inside the footwear,
inside the heel. That allows the users don’t be
conscious about the transmitter. To place it in the
shoe, the system must have autonomy. It will not be
possible recharge it during his useful life. Therefore,
in the choice of location system, the energetic
consumption and the size will be determinant.
We are going to analyze the different location
technologies. We can classify them under two big
groups: outdoor location system and indoor location
system.
The maximum exponent of outdoor location
technologies is Global Position System (Nord et al.,
1998). It coexists with the incomplete system
GLONASS (Langley, 1997), and it will coexist with
GALILEAN (European Commission, 1999). All of
these global positioning systems have very small
coverage inside buildings so in this context the
location it is not possible.
Inside indoor technologies are based on wireless
technologies of communication. Using some
features about these wireless technologies we can
determine position of the transmitter. First we are
going to emphasize a system based on the wireless
technology bluetooth (Bluetooth SIG, 2001), named
Bluetooth Indoor Positioning System (Dark and
Delmastro, 2001). The core of the system is a
network of bluetooth access points, distributed
inside the building every 10 meters. The system is
coordinated by a central computer. This system is
appropriated for small buildings due to the limited
coverage of every node. We need a great number of
nodes. The positioning is realized by means of sign
triangulation. It is necessary synchronize to all the
access points.
RADAR (Bahl and Padmanabhan, 2000) is
based on the standard IEEE 802.11 Wireless LAN
(IEEE, 1999). It combines empirical measures with
models of the sign spread, to determine the location
user. This system provides more precise results than
the previous though reverberating in a high cost.
By means of the technology named
Transmission Error Approximation (Xiao et al.,
2006), the distance is determined between two
zigbee devices. They measure up and analyze
statistically information of the packets that have not
arrived to their destination. The transmitter sends
different packets each one with a size and different
energetic level. Therefore, this technology is not
adapted for systems that need great autonomy.
Leaving aside the systems based on wireless
technology, we meet a system named GETA
Sandals. (Yeh et al., 2007). It is composed by two
sandals equipped with force, ultrasonic, orientation,
RFID sensors and accelerometers. It allows verify
the position from the initial point, adding placement
vectors that are formed while you are walking. This
system needs few infrastructures, but presents some
difficulties. The travelling error is accumulating, so
it is necessary to put some control points.
Each of the previous technologies presents a few
advantages and disadvantages for our objective. We
are developing an alternative indoor location
technology based on the drift that suffers the multi-
frequency electromagnetic field when cross a well-
know medium, (Ferrández, 2007), (Pujol et al,
2005), (Ferrández et al, 2007). It works emitting an
electromagnetic multifrecuencial signals, and then
we measure the delay that is produced between the
frequencies on having crossed the way. By means of
this technique we can determine the distance using
only a receiving aerial, avoiding the triangulation. In
addition the transmitter only must emit a pulse
periodically; therefore the consumption will be low.
The delay that suffers each of the frequencies is in
A VISUAL INTERFACE BASED ON THE MVC PARADIGM TO LOCATE PEOPLE
261
the range of nanoseconds. The cost of the equipment
capable of measuring it is high.
The services module is the application that
simulates the services derived from the position,
manages the persons to locating, and monitors the
position throughout the time. This application is
going to be used by the final user.
We propose the development of a common base
application useful to all the areas where the system
could be implanted. The services module must show
a plane of the building and each person in his current
position. Thinking about geriatric centres or
colleges, we will want that the system warns us if
someone goes in or goes out of a certain zone. Also
we will wish that the system learns the behaviour of
each one. If we think about a hospitable
environment, a possible service would warn
automatically the more nearby doctors to the
urgency.
3 SERVICES MODULE
The visualization environment provides mechanisms
to manage, to monitor and simulate the services
derived from the children's location inside a college.
In figure 2 we can observe it when it is launched.
The implemented services are: S1, to know every
time where each person in the building is; S2, to
know where a person is at the present time; S3, to
know the information of the persons to locating; S4,
Figure 2: Environment aspect when is launched.
to know where the persons have been throughout the
time. Saving and analyzing these positions data we
will obtain standards of behaviour; S5, warns us
about an accident; S6, the system warns us when
someone goes in a room, which is in secure way.
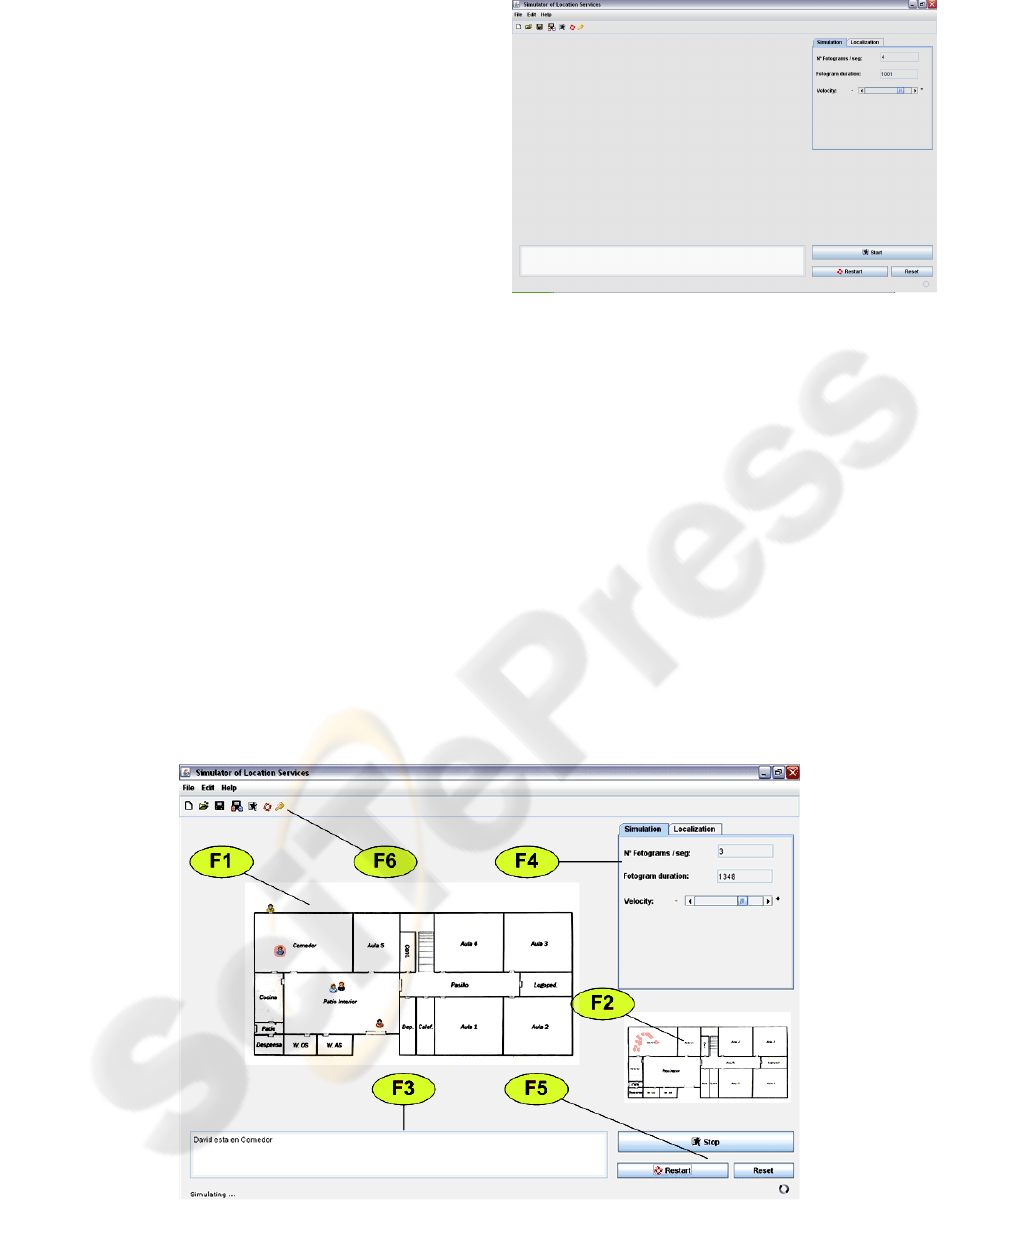
The environment provides the services previously
described by means of graphical interface. They
allow using any service. In the figure 3 we can
identify the main widgets.
The principal graphical visualization, F1, takes
charge representing the facilities of the building and
the position of each one of the persons in the current
time. It allows to select graphically form the persons
and to put them along the plane, to locate them in
another stay, even while the simulation is realized. It
allows select the stays to establish them in secure
way or in normal way.
Figure 3: The window contains the main widgets to control the application.
HEALTHINF 2008 - International Conference on Health Informatics
262
The secondary graphical visualization, F2,
represent the plane from the building a smaller scale,
reflecting graphically the positions of the selected
person.
Figure 4: State of the environment when a person is inside
a secure room.
The visualization in way text, F3, shows the
incidents and the position of all the persons. When a
person has been selected, only the information about
the position of this person is shown.
It is possible to manage the frequency of the
simulation. The frequency is specified in
milliseconds. In every period the new position of the
persons is calculated and the changes produced are
represented in the environment.
There are a set of controls widgets, F5. They
allow to start, stop or to restart the system.
Activating the sure way, F6, the system will
warn us when someone goes in one secure room. In
the figure 4, we can see one image of the
environment informing us about an incident. This
incident shows a person inside the secure room. The
room is shaded and a text message is showed.
3.1 Structure
The environment is structured to facilitate the
maintenance, the reutilization of the source code and
the detection of mistakes.
The modular division has been realized to
facilitate the incorporation of new services. We have
used the design model Model View Controller,
MVC, (Sommerville, 2004).
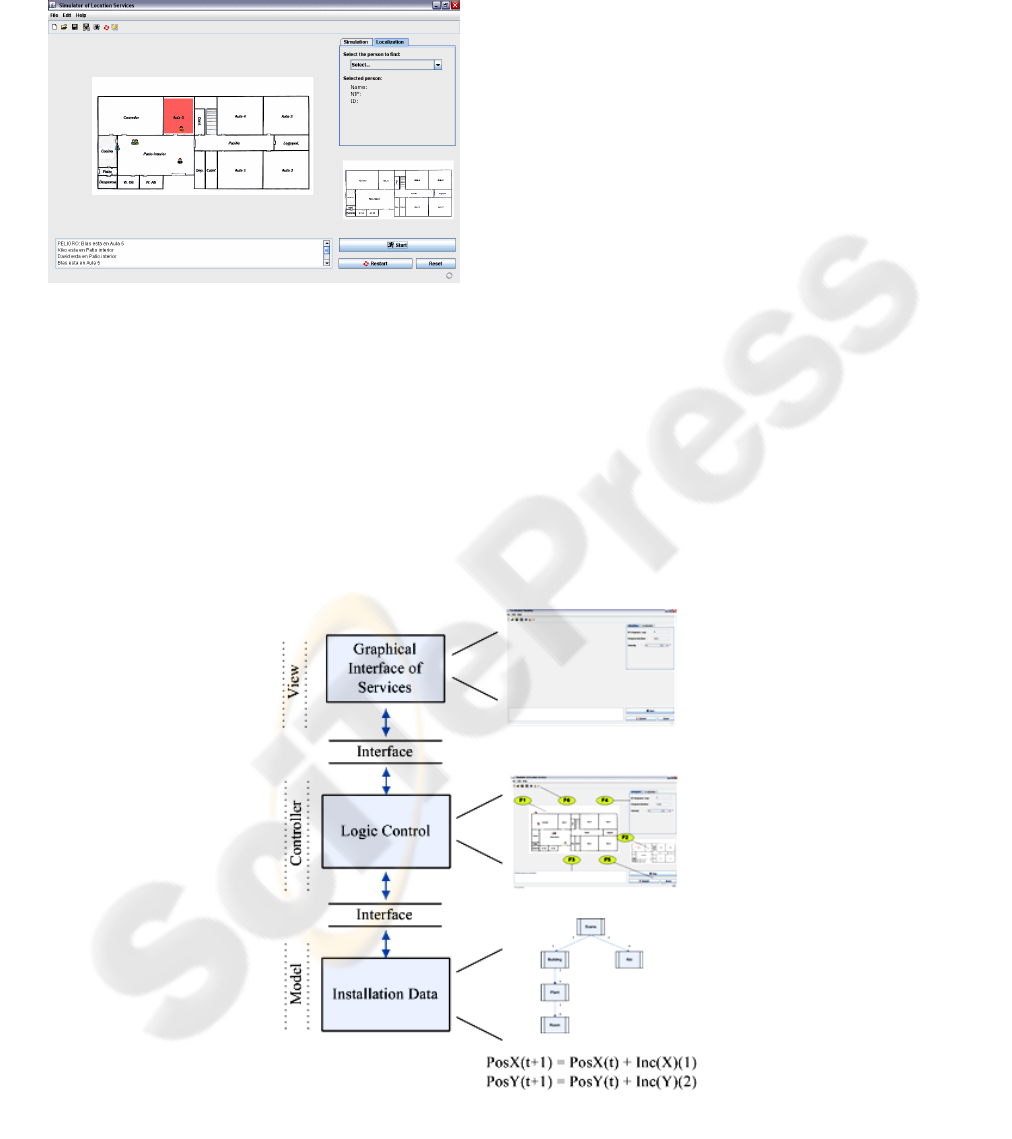
The environment is structured in three layers:
graphical interface of services, logic control and
installation data. It is possible to observe in the
figure 5 the correspondence between the pattern
MVC, the environment layers and the environment
elements. The graphical interface of services layer
corresponds to the view layer of the model MVC. It
defines the graphical user interface. The controller
corresponds to the logic control layer. It is the logic
of the application. It takes charge managing the
time, the events of representation, the visualization
of the objects of the
scene, and the beginning and the
Figure 5: Correspondence of the environment layers and the elements with the model MVC.
A VISUAL INTERFACE BASED ON THE MVC PARADIGM TO LOCATE PEOPLE
263
end of the simulation. It uses the events of user. The
user can interact asynchronously with the control
widgets: F1, F2, F3, F4, F5 and F6. The model is
represented by installation data layer. It takes charge
storing the necessary information to represent the
facilities of the college and children, and defines
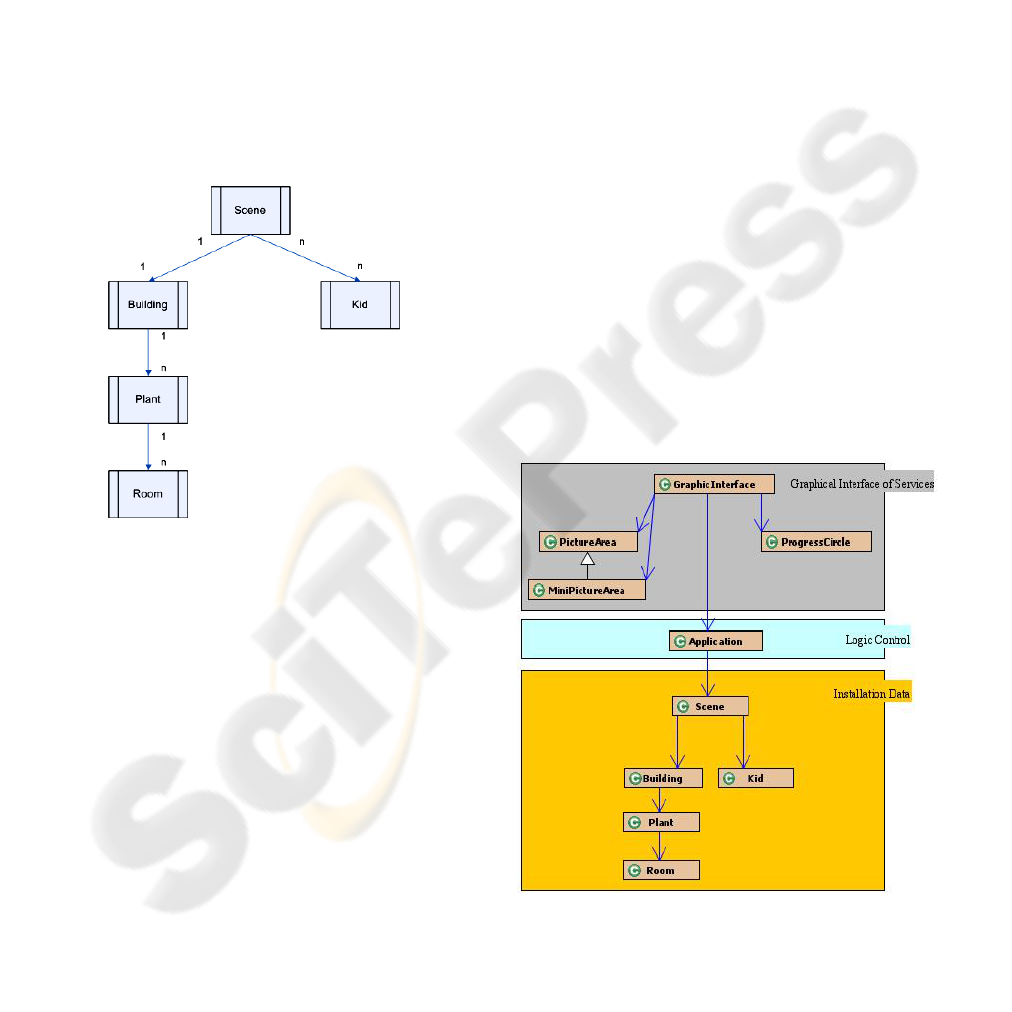
events of representation for each one. The
information is formed by a hierarchy of entities
grouped under the entity Scene. Scene contains a list
of entities Kid. They represent the children who are
inside the college. The entity Scene also includes the
entity Building that represents the building and
contains a set of entities Plant. These entities
represent the floors of the building. And each of
these contains a list of entities Room. The entity
Room represents the rooms of the floor. This
hierarchy can be observed in the entity relationship
graph showed in figure 6.
Figure 6: Entity relationship diagram of the scene.
The representation events are executed when it is
necessary to update the person's position. Later, the
general state of the scene is determined, and the
changes are represented in all the views. In the
prototype, we simulate the movement of the persons,
We will establish the starting point of each person
and later when beginning the simulation, each one of
these people will move randomly. The random
movement has been implemented from the present
position, PosX (t). To this position a random
displacement is added to him, Inc. (X), obtaining
therefore the new position, PosX (t+1), for the
following moment of time. This one calculation will
be made for each one of the coordinates. In
equations 1 and 2 we can observe the calculation of
coordinate X and Y, respectively.
PosX(t+1) = PosX(t) + Inc(X) (1)
PosY(t+1) = PosY(t) + Inc(Y) (2)
3.2 Implementation
The programming language is Java because is a
multiplatform, object-oriented and facilitates
integration in web platforms.
The environment is organized in a set of layers.
Every layer is implemented by means of a set of
classes. In the figure 7 it is possible to observe the
corresponding class diagram. The graphical interface
of services layer is composed by 4 classes.
GraphicInterface takes charge managing all the
elements of the graphical user interface. PictureArea
takes charge realizing the representation in the
graphical principal visualization F1.
MiniPictureArea is a subclass of the previous one,
and it overwrites his visualization method, because
in graphical secondary visualization F2, we show
different information from the parent class.
ProgressCircle takes charge representing a circle
animation. The animation is visible while the
simulation is on. The logic control layer is formed
by unique class. It is called application and contains
the simulation engine, the services that it offers to
the user, and the communication with the graphical
interface of services layer and installation data layer.
The base of the simulation engine is implemented by
means of a thread clock. This clock is configured in
milliseconds. In each event the new position of each
person is obtained, the model is modified and the
new scene is represented.
Figure 7: Class diagram for each one of the layers that
forms the service module.
The installation dates layer is formed by 5
classes. They represent the scene to simulate and
HEALTHINF 2008 - International Conference on Health Informatics
264

contain the information defined in the entity
relationship diagram showed in figure 6. The
representation of the scene is in charge to update the
state of all the objects that take part, determining the
interactions to each other. In the first place the plane
of the plant of the building is drawn. Later the safe
rooms are marked by means of a shade of yellow
colour. If a child has entered some secure room, it
will be marked with a red shade. If the user has
selected some child, then a red circle will be drawn
in the child position, and finally every child are
drawn in its respective position.
4 CONCLUSIONS
In this paper, we have presented an interface to
assist a location and tracking system that solves the
problem when global positioning systems are
unable. We have shown the potentialities of these
services to satisfy the necessities in schools,
hospitals, industries and old people’s centres and we
have introduced a simulation tool that serves as user
interface and to configure the system.
We consider a software implementation in Java,
because it offers a platform independent and it has
many networking capabilities to build distributed
systems, for example to remote data acquisition
from sensors.
As future works, we will work to evaluate some
of the main indoor location system to integrate it and
add new features to the module services.
ACKNOWLEDGEMENTS
This work has been partially supported by spanish
government as I+D project: Desarrollo de
herramientas CAD/CAM para el prototipado virtual
en el sector calzado. DPI2005-09215-C02-01.
REFERENCES
Bahl, P. and Padmanabhan, V., 2000. RADAR: An in-
building RF-based user location and tracking system.
Proceedings of the IEEE Infocom 2000, March 2000,
Tel-Aviv, Israel. 775–784.
Bruno, R. and Delmastro, F., 2003. Design and Analysis of
a Bluetooth-Based Indoor Localization System. In:
Springer Berlin / Heidelberg eds. PersonalWireless
Communications. Berlín: Springer, 711-725.
European Comision, 1999. Galileo Involving Europe in a
New Generation of Satellite Navigation Services.
Brussels: European Comision.
European Comision Eurostat, 2006. EU25 population
aged 65 and over expected to double between 1995
and 2050. Luxembourg: European Comision Eurostat.
Ferrández, F.J., 2007. Deriva frecuencial de la
transmisión electromagnética por efecto del medio.
Thesis (PhD). Alicante University.
Ferrández, F.J., Valdivieso, R.J and Albert M..M. 2007.
FootLose, zapatos para la localización de personas.
FUNDEUN, University of Alicante.
IEEE, 1999. IEEE Standard for Wireless LAN. Medium
Access Control and Physical Layer Specification.
P802.11. Piscataway:IEEE.
IEEE Standard Association, 2001. Bluetooth SIG.
Specification of the Bluetooth System, Volume 1–Core.
Version 1.1, New York:IEEE.
Instituto nacional de estadística de España, 1999. Encuesta
sobre Discapacidades Deficiencias y Estado de Salud.
1999. Madrid, Spain.
Langley, R. B. 1997. GLONASS: Review and update. GPS
World, July, Vol. 8, No. 7, 46-51.
Ministerio de Trabajo y Asuntos Social, 2005. Atención a
las personas en situación de dependencia en España,
libro blanco. Madrid: Instituto de mayores y servicios
sociales.
Nord, G., Jabon, D., Nord, J., 1998. The global positioning
system and the implicit function theorem. In: R.
Sincovec, ed. SIAM Review, v.40 n.3. 692-696.
Sommerville, I. 2004. Software Engineering, 7th ed.
Boston: Addison-Wesley.
Pujol, F.A., Ferrández, F.J., García Chamizo, J.M., Fujol,
M. and Rizo, R. 2005. Numerical analysis in position
location: a frequency-domain model. Kybernetes: The
intenational Journal of Systems & Cybernetics. Vol.
34, 704-710.
Xiao, W., Sun, Y., Liu, Y., Yang, Q., 2006. TEA:
Transmission Error Approximation for Distance
Estimation between Two Zigbee Devices. International
Workshop on Networking, Architecture, and Storages,
2006, Shenyang, CHINA, 15-22.
Yeh, S., Chang , K., Wu, C., Chu, H., Hsu, J.Y., 2007.
GETA sandals: a footstep location tracking system. In:
Springer London eds. Personal and Ubiquitous
Computing. London: Springer, 451-463.
A VISUAL INTERFACE BASED ON THE MVC PARADIGM TO LOCATE PEOPLE
265
