
A DECISION SUPPORT SYSTEM FOR PREDICTING THE
RELIABILITY OF A ROBOTIC DISPENSING SYSTEM
J. Sturek, S. Ramakrishnan, P. Nagula and K. Srihari
Department of Systems Science and Industrial Engineering, Binghamton University, Binghgamton, NY, USA
Keywords: Robotic Dispensing System, Failure Mode Effects and Analysis (FMEA), Reliability Prediction.
Abstract: Decision Support Systems (DSS) are information systems designed to support individual and collective
decision-making. This research presents the development of a DSS to facilitate the prediction of the
reliability of a Robotic Dispensing System (RDS). While it is extremely critical for design teams to identify
the potential defects in the product before releasing them to the customers, predicting reliability is extremely
difficult due to the absence of actual failure data. Design teams often adopt tools such as Failure Mode
Effects and Analysis (FMEA) to analyze the various failure modes in the product. There are commercial
softwares that facilitate predicting reliability and conducting FMEA. However, there are limited approaches
that combine these two critical aspects of product design. The objective of this research is to develop a DSS
that would help design teams track the overall system reliability, while concurrently using the data from the
alpha testing phase to perform the FMEA. Hence, this DSS is capable of calculating the age-specific
reliability value for a Robotic Dispensing System (RDS), in addition to storing the defect information, for
the FMEA process. The Risk Priority Number (RPN) calculated using the data gathered serves as the basis
for the design team to identify the modifications to the product design. The tool, developed in Microsoft
Access
®
, would be subsequently utilized to track on-field performance of the RDS. This would facilitate
continuous monitoring of the RDS from the customer site, especially during its “infant mortality” period.
1 INTRODUCTION
Decision Support Systems (DSS) are computerized
information systems that support business and
organizational decision-making activities. A typical
DSS is an interactive software-based system
intended to help decision makers compile useful
information from raw data, documents, personal
knowledge, and/or business models to identify and
solve problems and make decisions. DSS have been
used in a wide range of domains, including
manufacturing, services, healthcare and military
applications, to name a few.
The DSS presented in this paper is deployed for
predicting the reliability of a new Robotic
Dispensing System (RDS). In addition to predicting
the reliability, the DSS also helps the design teams
to perform Failure Mode Effects and Analysis
(FMEA) on the RDS. Reliability prediction and
modeling is a crucial phase while designing a new
product. Analysis on the stochastic nature of the
failures and minimizing the probability of
occurrence of failures is an area of focus for
designers and reliability engineers. However,
predicting reliability is an extremely challenging
task, primarily due to the absence of data from the
field or systems testing. The failure data would help
design teams determine the various failure modes
and their effect on the overall product reliability.
Tools of quality engineering, such as FMEA and
Fault Tree Analysis (FTA) are employed to rectify
the design issues to meet the reliability goal.
There are numerous reliability prediction
softwares and approaches that are documented in the
literature. However, most of them use a “black-box”
approach to determine product reliability, based on
the available standards. This approach could result
in erroneous outcomes while designing a new
product. Hence, it is imperative to account for the
data from the alpha and beta system testing, while
estimating the product reliability.
This research effort presents an architecture that
can capture the defects during the testing phase and
help in predicting the age-specific reliability of a
RDS. A DSS, called the RDS Defect Tracker, was
developed that tracks the defects or failures in the
289
Sturek J., Ramakrishnan S., Nagula P. and Srihari K. (2007).
A DECISION SUPPORT SYSTEM FOR PREDICTING THE RELIABILITY OF A ROBOTIC DISPENSING SYSTEM.
In Proceedings of the Ninth International Conference on Enterprise Information Systems - AIDSS, pages 289-296
DOI: 10.5220/0002399102890296
Copyright
c
SciTePress
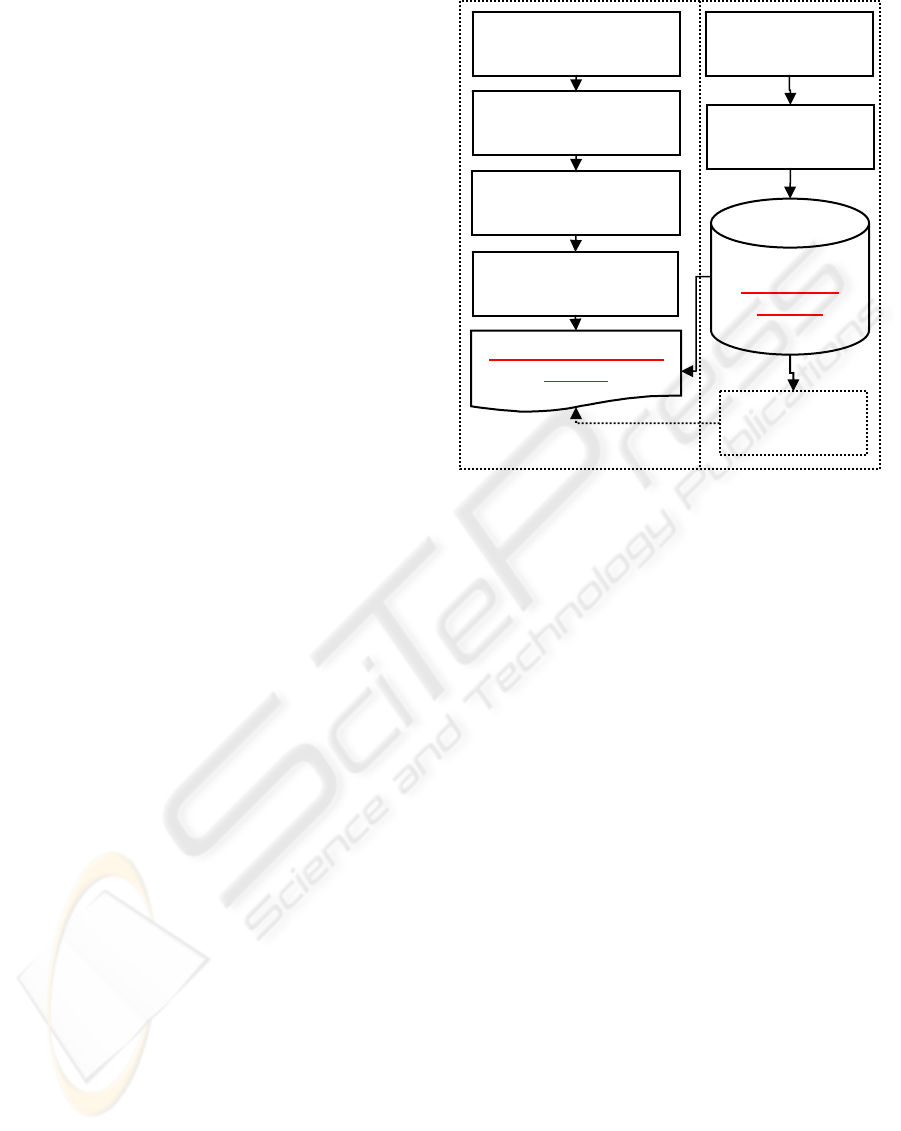
RDS during system testing. The defect information
is then converted into a Risk Priority Number (RPN)
value used for the failure analysis by the design
teams. The RDS Defect Tracker has the capability to
calculate the Mean Time to Failure (MTTF), which
then updates the reliability values. The proposed
architecture is expected to “bridge the gap” between
the reliability prediction methods and FMEA – a
limitation of the existing commercial softwares or
any available literature in this domain. The overall
scope of this research is summarized in Figure 1.
This paper is organized as follows. Section 2
presents the pertinent literature for reliability
prediction and FMEA, and the existing commercial
softwares. The proposed methodology in the
research is presented in Section 3. Section 4 presents
the system architecture and the key features of the
RDS Defect Tracker. An illustrative case study of
the system is presented in Section 5. The paper
concludes by summarizing the contributions of the
research and potential extensions.
2 REVIEW OF LITERATURE
FMEA and reliability prediction are two critical
processes that help in defining the failure modes and
their effects on a system. However, it is extremely
challenging and time consuming to conduct these
analyses. In ideal circumstances, the FMEA should
be conducted during the early stages of product
development.
A review of the pertinent literature suggests that
reliability modeling is a well-researched area,
especially while designing softwares or complex
systems. However, there are very few approaches
that integrate reliability prediction modules with the
design process. In the recent past, neural networks
have been used to monitor, predict and improve
realibility estimations. Chen (2006) and Bevilacqua
et al. (2005) showed that neural networks have the
ability to predict a reliability value more accurately
than traditional analytical models, since it makes use
of failure history when available. Design teams find
it extremely important to record the systems test and
repair information in a DSS for identifying future
trends using historical data. Commerical statisitcal
packages, such as Statit and Relex, have modules
which help performing FMEA using the data from
the testing. Puente et al. (2002) developed a DSS
that focused primarily on conducting FMEA for
complex systems. Table 1 summarizes the pertinent
research available in the application of DSS in
predicting reliability and conducting FMEA.
Figure 1: Overall scope and framework of research.
Based on the above review of the literature, it
can be concluded that, currently, no system exists
which can perform reliability prediction and
facilitate FMEA using data from the alpha and beta
testing of a system. The integrated approach
proposed in this research would address this
concern, especially during new product introduction.
The neural network module proposed in this
architecture is designed to anticipate the future
failure modes in the system, based on the historical
data. This would help the design team to proactively
incorporate design changes, thus saving valuable
time and resources.
3 METHODOLOGY
The methodology adopted for this research can be
delineated as follows:
Identify the various components and the
process flow of the RDS;
Create two dimensional or three dimensional
matrices to identify the system relatedness
between sub-systems and/or components,
functions, and failure mechanisms;
Develop a data model and entity relationship
diagrams, based on the aforementioned
information;
Obtain target values for the reliability
measures;
Integrate results from the tests to the database;
Construct Reliability
Block Diagrams
Iden
t
ify Components/
Assemblies
Identify Similar
Components/ Assys.
Obtain their MTTF
Reliabilit
y
Prediction
Module
Identify Defec
t
Categories
Perform Unit/
System Test
RDS Defect
Tracker
Perform
FMEA/FTA
ICEIS 2007 - International Conference on Enterprise Information Systems
290
Calculate RPN values at component level and
update reliability measures;
Implement design changes and continuously
monitor system performance.
The following sections provide a detailed
discussion on the aforementioned stages of the
research.
Table 1: Overview of literature.
Related Area Description Authors
Approximates
failure rates:
most likely
failures estimated
using simulation
Price et al.
(2002)
FMEA
Focuses solely on
calculating RPN
utilizing DSS
Puente et al.
(2002)
Predicting
reliability:
improving
accuracy and
precision of
values
Chen
(2006)
Neural
Networks
Decision making
for maintenance
activities, failure
rate analysis
Bevilacqua
et al. (2005)
Reliability
Prediction
Reliability
Prediction
Prioritization
Index (RPPI):
groups failures
Coit et al.
(2001)
Testing
Strategies
Improvements in
FMEA process
and testing
strategies
Theije et al.
(1998)
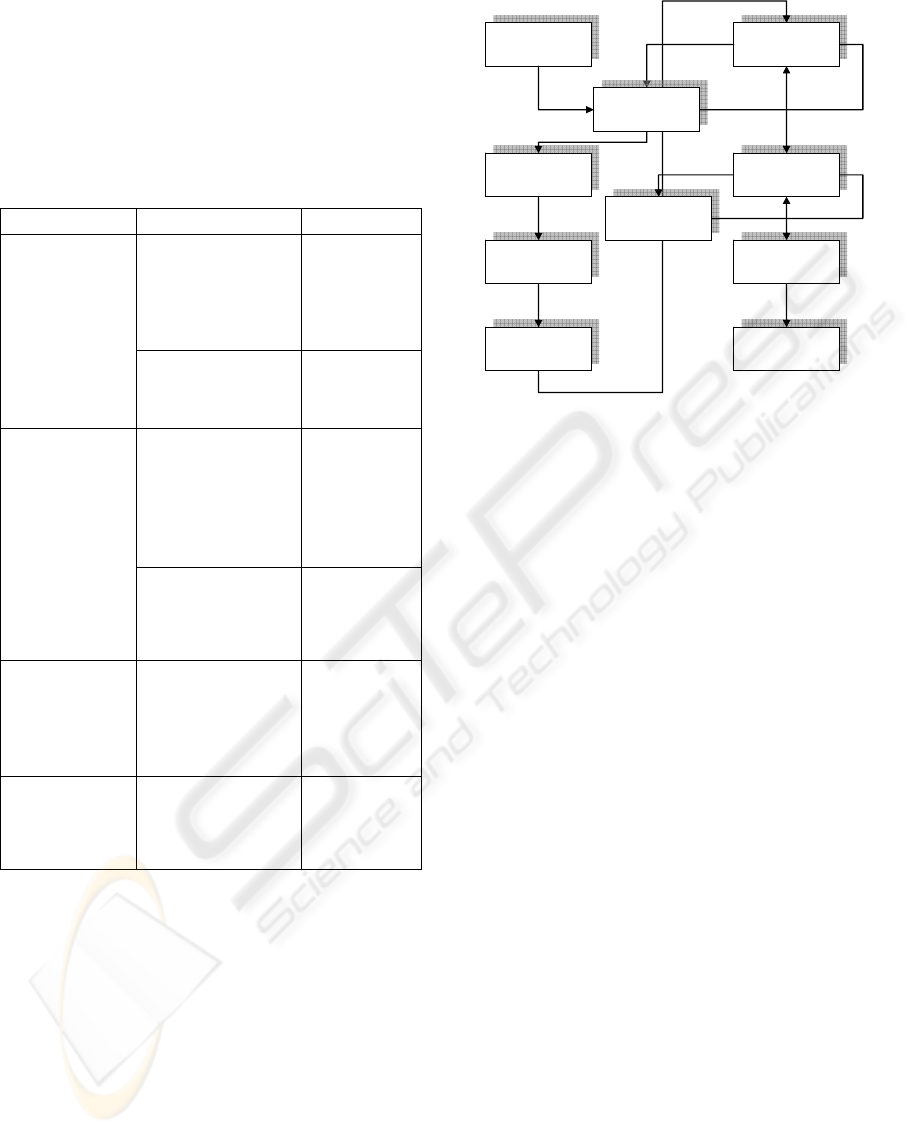
4 SYSTEM DESCRIPTION
This section presents the overall architecture of the
RDS Defect Tracker. As previously mentioned in
section 3, the first step involved the identification of
the key areas in the RDS. Figure 2 shows the major
functional units and the overall process flow.
Once the significant components were identified, the
design team needed to assign reliability measures to
each potential failure, in order to obtain an overall
reliability value. However, initial reliability
measurements were conducted and due to the
absence of data from the system testing, the values
had to be obtained from the military standards (MIL
Handbook). The MIL handbook provided the MTTF
values of the various components, which was then
used to determine the reliability value.
Ramakrishnan et al. (2006) presents the details of
the construction of the reliability block diagrams and
the methodology that was adopted to estimate the
reliability of the RDS. Additionally, based on
discussions with the design teams, the target
reliability measure was also documented. The
second module of the RDS Defect Tracker focuses
on identifying the various failure modes and its
effect on the reliability of the RDS. When the data
from testing the RDS becomes available, it can be
used to conduct the FMEA, by using the RPN
values. The design team uses the RPN value to
determine the most critical area(s) in the system and
where potential design improvements can be made
to eliminate and minimize the failure mode. Once
the design change is incorporated, the system should
be re-tested to calculate the new failure rate. Hence,
the system reliability can be continuously monitored
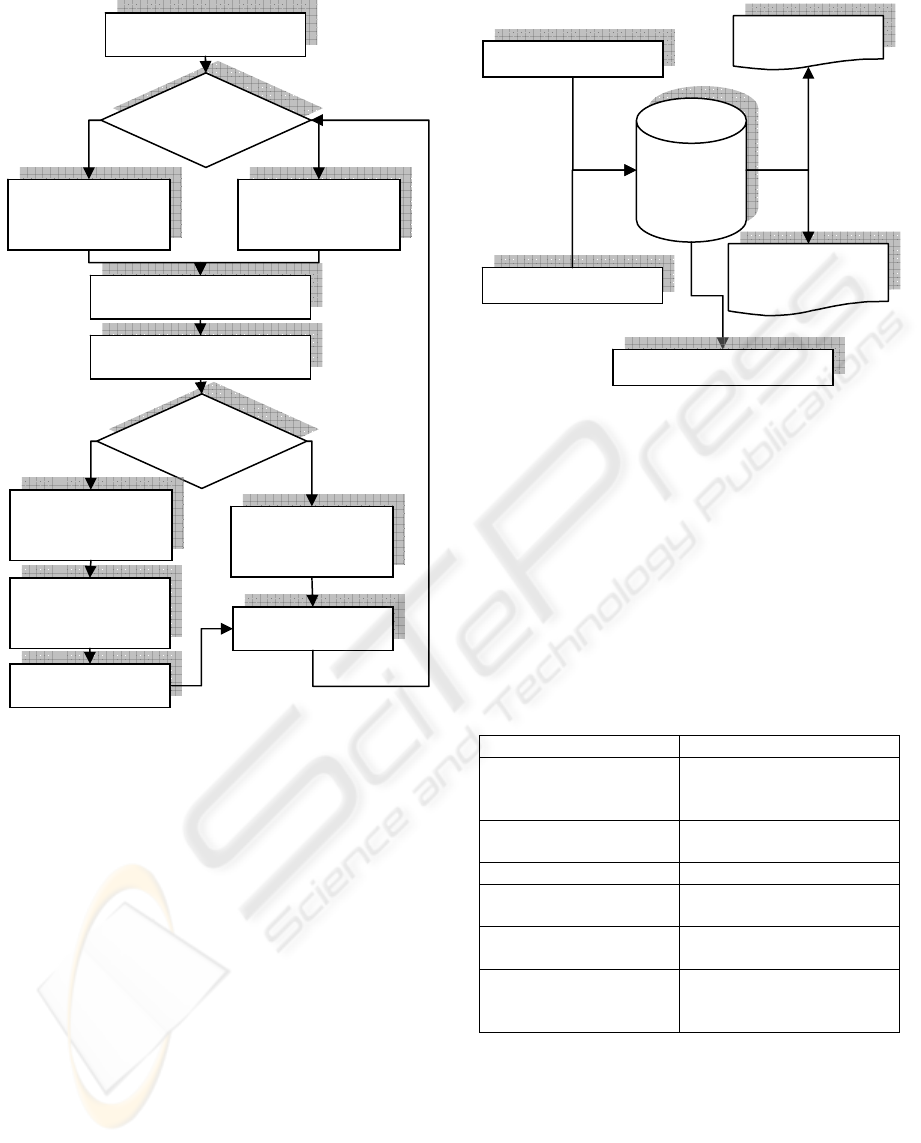
through this proposed architecture. Figure 3 shows
the algorithm of the architecture.
4.1 Architecture of RDS Defect
Tracker
The RDS Defect Tracker is developed in Microsoft
Access
®
that interfaces with a Microsoft Excel
®
module and a Perl Script for email notifications.
Figure 4 shows the architecture of the RDS Defect
Tracker.
Rotary
Gantry
Output
Queue
Verification
& Validation
Gantry
Prescription
Entered
Vial
Cassette
Vial
Dispense
Print
Apply
GUI
(Front End)
Capping
Unit
Figure 2: Key components and process flow of the RDS.
A DECISION SUPPORT SYSTEM FOR PREDICTING THE RELIABILITY OF A ROBOTIC DISPENSING SYSTEM
291
The test data from the system is fed to the RDS
Defect Tracker through a graphical user interface
(GUI). This can be done in batch mode through a
Perl script. In the case of missing data from the test
process, the MIL standards are fed into the reliability
prediction module. Based on the algorithm in Figure
3, the backend of the RDS Defect Tracker estimates
the MTTF, and subsequently the system reliability.
The test data is also is used to determine the
RPN value for each component in the RDS. When
the estimated reliability value is less than the
reliability target, an email is sent to the design team
with the key detractors and the calculated RPN
values. The design team then conducts the FMEA
analysis, rectify the design issues and then,
continues with the test process. Hence, this
architecture provides the design team a tool that
continuously monitors the performance of the RDS,
and quickly responds to the defects identified in the
test process.
Figure 4: Architecture of the RDS Defect Tracker.
4.2 Data Model
The physical data model of the RDS Defect Tracker
architecture is discussed in this section. The data
model tables and their functions are tabulated in
Table 2. The information from the testing of the
RDS can be updated either manually through the
GUI or automatically, via a Perl script. Hence, at the
end of a test run, the relevant data is fed into the
backend of the RDS Defect Tracker.
Table 2: Database tables and their functions.
Table Name Function
T_COMPONENT Contains name of the
various components in the
RDS
T_MIL_STANDARDS Contains MTTF values and
duty cycle: MIL Standards
T_RDS Names of existing RDS’s
T_CAP_DETAILS Contains details of the cap
type and the vial used
T_USERS Contains the names, roles
and email ID of the users
T_DEFECT_HISTORY Details of the observed
defect, date time, priority
and status.
4.3 Graphical User Interface (GUI)
The GUI of the RDS Defect Tracker is used to feed
the data from the system testing. It was also used to
analyze and view the history of the system tests that
were conducted. Customized reports can be
developed to help the design teams facilitate the
Identify Components
Test Data
Available?
Calculate
Failure Rate, (λ)
Obtain λ from
MIL Handbook
Calculate MTTF
Determine Reliability
Is Goal
Met?
Calculate RPN
Conduct FMEA
Design Change
Update RPN,
Control Charts
Update Control
Charts
Monito
r
N
o
N
o
Yes
Yes
Figure 3: Algorithm of the RDS Defect Tracker.
RDS
Defect
Tracker
Test Data
(
txt file
)
MIL Standards
Control Charts
RP
N
Estimation
Email to Desi
g
n Tea
m
Perl Scri
pt
Perl
Script
ICEIS 2007 - International Conference on Enterprise Information Systems
292
failure analysis. The following sections presents the
key features of the GUI.
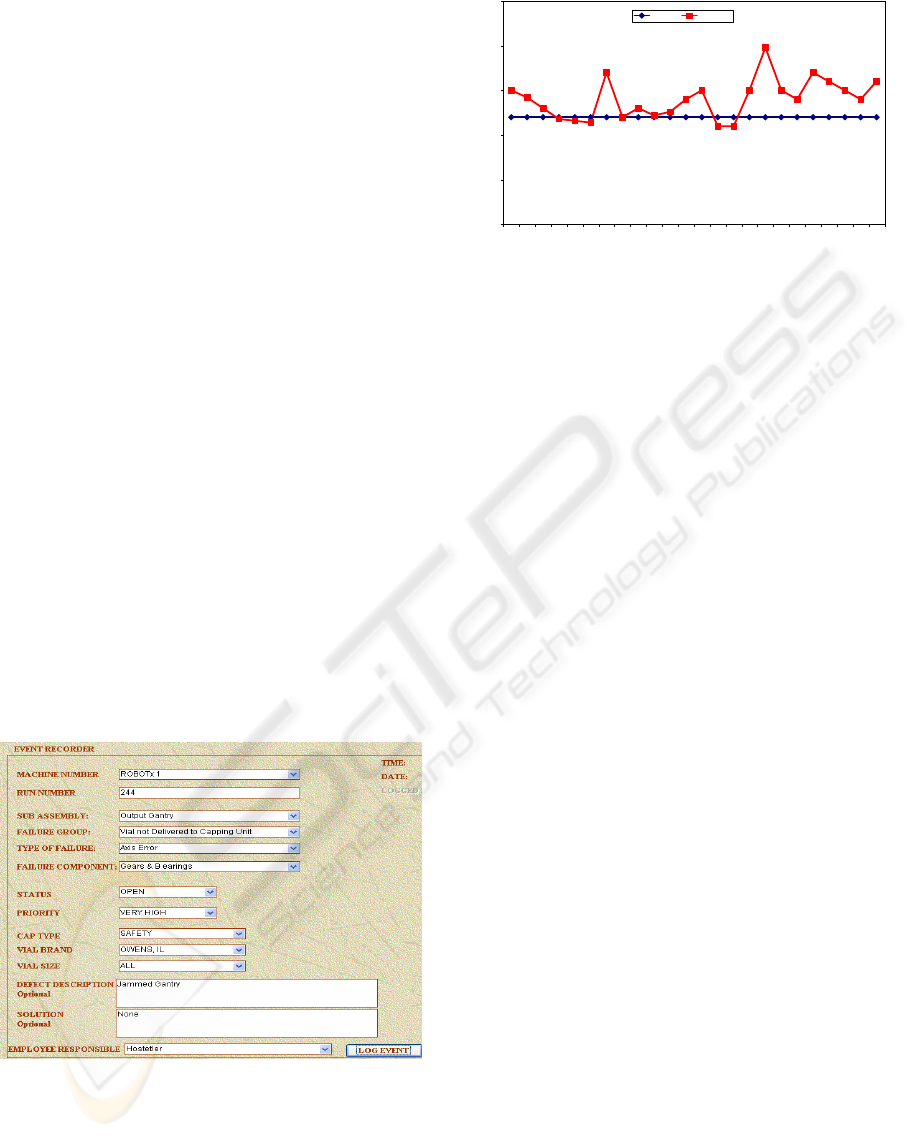
4.3.1 Data Feed Module
The GUI has the data entry screen wherein the test
engineer can enter the details of the observed defect
in the test. This would be updated into the backend
of the RDS Defect Tracker. Each defect is assigned
a priority level and the engineer responsible to
attend to the observed defect. A tracking number for
the entry is generated for reference. An electronic
mail is sent to the assigned engineer, with the
observed defect information. In the event of error-
free runs, corresponding tables and fields are
incremented, via a batch job. Figure 5 shows the
data entry module of the RDS Defect Tracker.
When the defect information is entered, the
MTTF for the specific component is calculated and
updated in the tables. Historical records of MTTF
values are also maintained for trend analysis. Using
the current MTTF values, the overall system
reliability is estimated and compared against the
reliability target.
4.3.2 ‘MTTF Monitoring’ Charts
Comparison of the system MTTF and reliability
measure against the target values is one of the key
features of this tool. As shown in Figure 6, a real-
time plot of the system MTTF is generated on the
completion of a test run.
Figure 5: GUI of the RDS Defect Tracker.
The RDS Defect Tracker updates the MTTF and
reliability measures and continuously monitors these
metrics. When the actual MTTF or reliability
exceeds the target, an e-mail is generated and sent to
the design team for immediate attention. The tool
then updates the RPN value based on the observed
defects, which is then used by the design team to
conduct the FMEA. The details of this process are
discussed in Section 5 through an illustrative
example. The flexibility provided to integrate the
data from the system tests with the reliability
prediction module makes this approach unique when
compared to the existing softwares and
methodologies.
4.3.3 Defect History Report
Another report generated by the DSS is the defect
history report. This is used along with the RPN
report previously discussed. The various defects that
need to be addressed by the design team are
presented in this report. Based on these findings, a
Pareto chart of the most significant defects is also
generated.
4.3.4 Neural Network Module
The RDS Defect Tracker provides a solution to
capture and analyze the defects during system
testing. However, it does not have the built-in
intelligence to predict the location and timing of the
next defect. As a result, design teams need to be
reactive to an observed defect, rather than being
proactive. An “intelligent system” that can predict
the occurrence of the next defect would be a
valuable addition to the RDS Defect Tracker.
Predicting the reliability of multiple-component
systems is gaining popularity, as systems become
more complex and more difficult to analyze and
assess for reliability (Brietler and Sloan, 2005).
Although neural networks have been used to predict
failure modes in systems, there are other aspects and
relationships that need to be considered, with a goal
of developing a generalized approach to predict
system reliability. Using the historical defect data
0
5
10
15
20
25
1 2 3 4 5 6 7 8 9 101112131415161718192021222324
Runs
MTTF
Target Actuals
Figure 6: MTTF (Actual versus Target).
A DECISION SUPPORT SYSTEM FOR PREDICTING THE RELIABILITY OF A ROBOTIC DISPENSING SYSTEM
293
from the systems testing and corrective actions taken
by the design teams, a neural network module to
predict the failure modes and repair actions for the
RDS is currently being developed. This intelligent
module will subsequently be integrated with the
RDS Defect Tracker for a more efficient Decision
Support System (DSS). The architecture and results
of the neural network model will be discussed in a
subsequent research paper.
5 ILLUSTRATIVE CASE STUDY
This section presents a case study wherein the RDS
Defect Tracker was used to conduct failure analysis
and reliability predictions for the RDS. The
objective of this study was to demonstrate the ability
of the RDS Defect Tracker to provide the design
teams information to make timely design changes, in
order to meet the reliability goal.
As mentioned in Section 4, the first step
involved identifying the MTTF values for the key
components of the RDS. Since there was no
historical data available, MIL standards were used to
assign these values. Using these values, the
reliability of the RDS was estimated to be 25
months. In order to make better predictions and
reduce the amount of uncertainty contained in the
T_MIL_STANDARDS reliability values, tests were
conducted to more precisely and accurately measure
the reliability of the system. As the test data became
available, the RDS Defect Tracker was updated in
the
T_DEFECT_HISTORY table which thus replaced
previous “default” values.
Once the alpha testing of the RDS commenced,
the tables were updated with the observed defect
information. When a statistically valid set of
observations were available for each component in
the RDS, the RDS Defect Tracker generated a report
with the key detractors that affected the overall
system reliability. These detractors are summarized
in Table 3. Additionally, the system reliability and
MTTF was also measured using the aforementioned
data. It was found that the RDS’s MTTF was
approximately 28 months, which was significantly
higher than the MTTF predicted using the MIL
standards. Clearly, it can be concluded that the data
from the system testing provided a more accurate
representation of the system reliability.
The design team then analyzed the list of all the
defects that were found at a component level. This
data was obtained from the “Defect History Report”
module in the RDS Defect Tracker. A Pareto
analysis conducted by the tool, based on the
historical data provides the information to the design
team regarding the key areas within a component
that needs to be addressed.
The same report feeds the design teams with the
RPN value to facilitate the FMEA exercise. RPN
provides the team with detailed information using a
scale based on severity, occurrence, and detection.
The higher the RPN value, the specific component-
detractor combination becomes more critical from a
failure analysis perspective. Table 4 highlights the
major assembly areas that were identified as the
most critical areas in the RDS design.
Table 3: Key components for reliability prediction.
Unit Area
(Device)
Function
Failure
Rate (hrs)
Cumulative
Failures Hrs
(per 1000)
Vial Transport
(DC Motor)
22,500 0.0444
Print Apply
(DC Motor)
22,500 0.0444
Printer 50,000 0.0200
Pneumatics
(Compressor) 363,636 0.0028
Rotary Gantry
(Servo Motor) 641,026 0.0016
Gantry
(Stepper Motor) 2,727,273 0.0004
Gantry
(Air Cylinder)
4,500,000 0.0002
Orient
(Air Cylinder)
9,000,000 0.0001
PLC 9,000,000 0.0001
Once the design team conducted the FMEA,
changes to the design were identified and
implemented to the system design. The test runs
were renewed and the process was continued until
the reliability goal was achieved. A steady state
needs to be achieved before the design team can
move the RDS to the production phase.
As mentioned in Section 4, the RDS Defect
Tracker provided the design team a report of the
critical detractors during test through e-mail alerts
and customized reports. The design team followed
the criteria listed below, using the DSS for gathering
data and conducting analyses:
(i) Component was in the top 10 list for both
reliability and RPN;
(ii) Component greatly impacted one of the
scales;
(iii) Component was cost-effective to fix;
ICEIS 2007 - International Conference on Enterprise Information Systems
294
(iv) Component was relatively easy to fix; and
(v) Reliability team deemed component as most
critical to overall system success.
Table 4: Top failures identified using RPN.
Sub
Assembly
Type of
Failure
Component
Failure
RPN
Value
Gantry
Axis
Error
Belts, Pulleys
& Guides
234.93
Output
Gantry
Axis
Error
Stepper
Drive
193.19
Output
Gantry
Axis
Error
Gears &
Bearings
168.24
Gantry
Axis
Error
Stepper
Motor
151.08
Output
Gantry
Axis
Error
Servo
Drive
147.78
Print
Apply
Print
Apply
Roller 133.16
Vial
Cassette
Sensor Alignment 127.68
Print
Apply
Print
Apply
Solenoid 110.14
Output
Queue
Conveyor
Belt
Alignment 103.75
Vial
Orientate
Flipper
Cone
Alignment 64.48
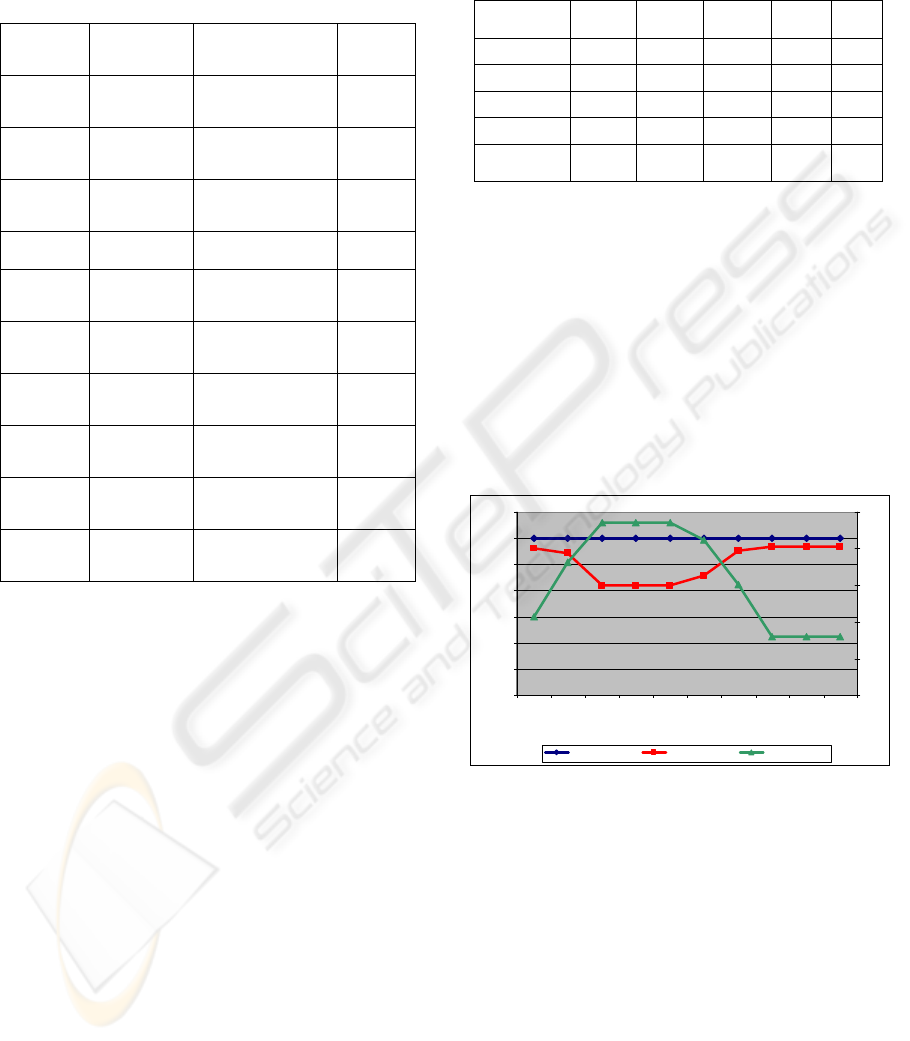
As the testing progressed, it was observed that
the failure modes of the belt, pulleys and guides
were not recognized during the initial tests. An
email notification was sent to the design engineer
after the reliability value for the belt, pulleys and
guides were updated and calculated in the RDS
Defect Tracker, as the highest failure point. Table 5
illustrates an example of a trend analysis report that
was made available by the RDS Defect Tracker. As
shown in the table, the system MTTF improved to
28.4 months, with the severity of the detractors
decreasing significantly. The ability to closely
monitor and efficiently track failures in the RDS
Defect Tracker, enabled the design team to monitor
the critical failure modes in the RDS. Figure 7
shows the effect the RPN value of identified failure
and its impact on the overall system reliability to the
system reliability goal. From the above illustration,
it can be concluded that the RDS Defect Tracker had
a significant impact in providing an effective
medium for the design team to perform failure
analysis. It should be mentioned here that the reports
provided by the DSS have extremely granular and
drill-down capabilities, thus providing a faster
identification of the failure mode.
Table 5: RPN trend analysis of critical failure.
Failure 1 Run 1 Run 2 Run 3
Run
4
Run
5
RPN Value 106.8 234.1 160.1 60.3 41.8
Severity 4.2 7.6 7.3 3.5 2.9
Occurrence 4.8 5.6 5.1 4.2 3.9
Detection 5.3 5.5 4.3 4.1 3.7
MTTF
RDS 28 20.9 22.90 27.6 28.4
6 CONCLUSIONS
While introducing a new product, many
uncertainties exist about its performance and
reliability. However, it is extremely difficult to
predict the reliability or identify the failure modes of
a product, when there is no historical defect data.
The goal of any design team is to identify a majority
of the failure modes in the product prior to customer
use.
0
5
10
15
20
25
30
35
1234 5678 910
WEEK
MTTF (Months)
0
50
100
150
200
250
Reliability Target Actual Reliability Belts & Pulleys
Figure 7: Effect of identified failure on system MTTF.
RDS Defect Tracker is a DSS developed to
monitor the system reliability and facilitate the
FMEA process, by feeding the design teams with
failure modes detected during testing. The DSS also
has in-built reports and trend analysis charts to study
the behavior of the system, or each component. The
proposed neural network module would help predict
the future failure modes, based on historical data.
Table 6 highlights the potential benefits that could
be realized by implementing the RDS Defect
Tracker.
A DECISION SUPPORT SYSTEM FOR PREDICTING THE RELIABILITY OF A ROBOTIC DISPENSING SYSTEM
295
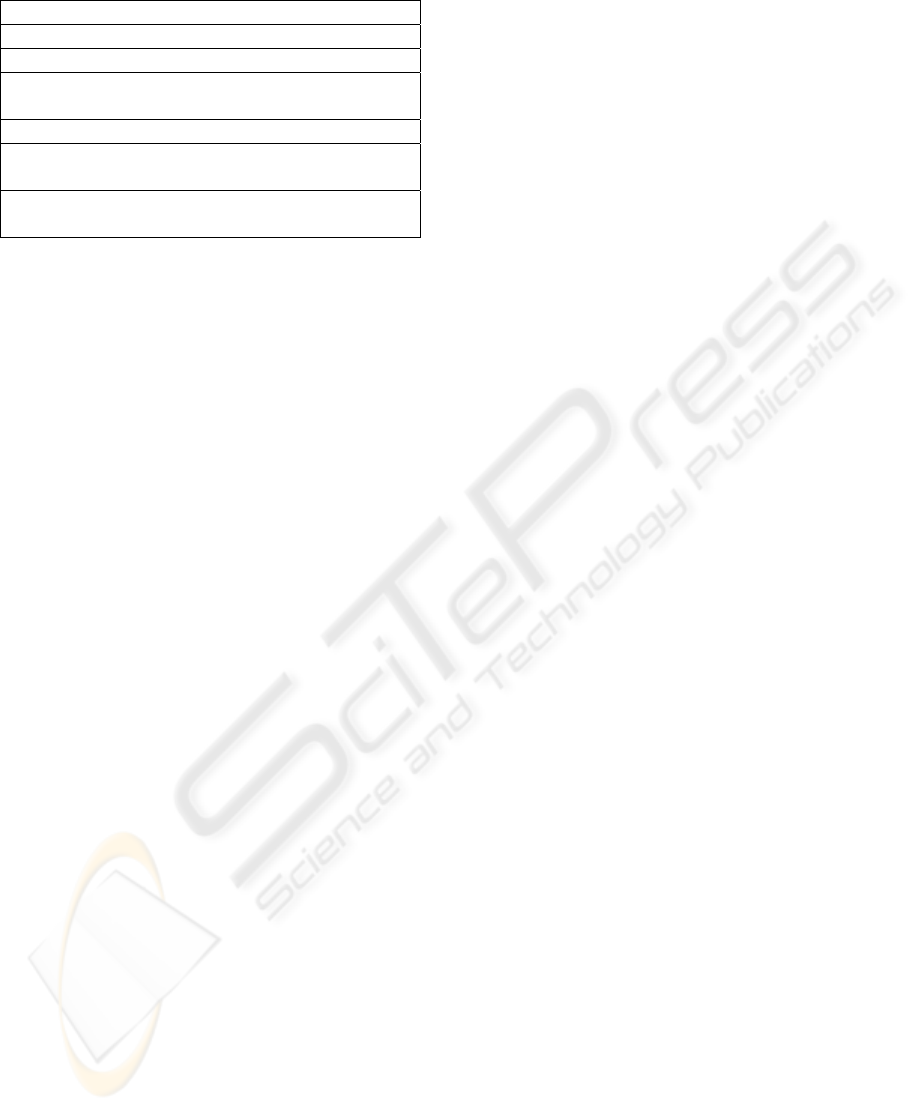
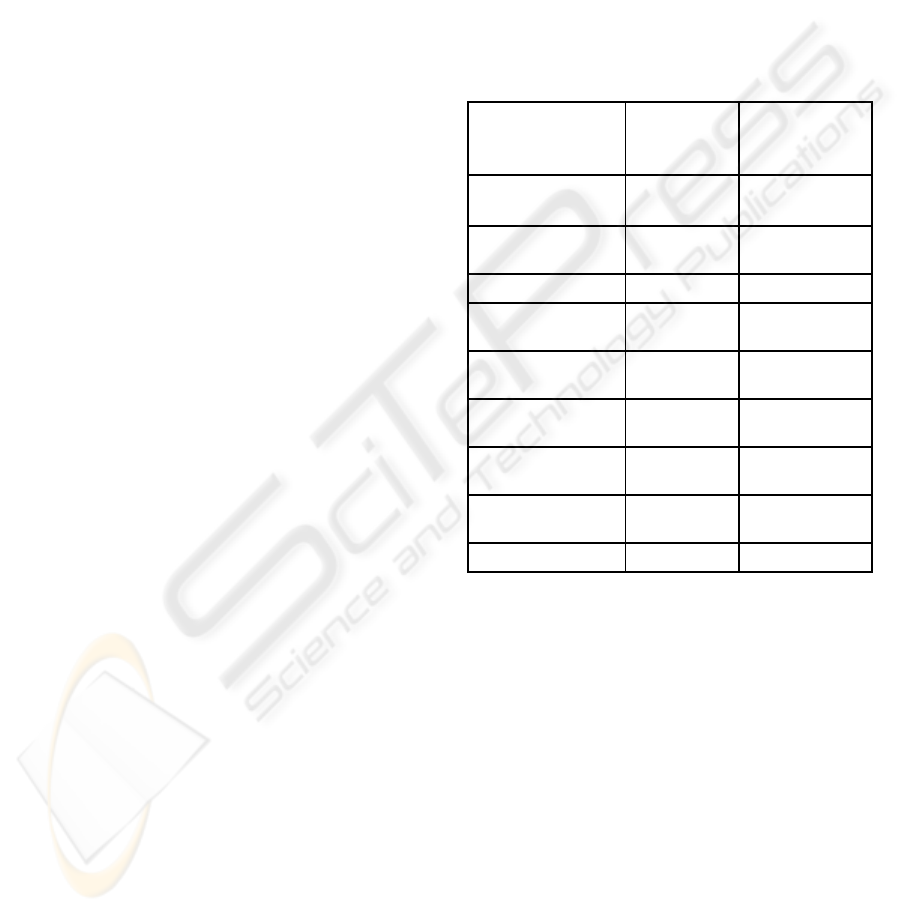
Table 6: Benefits of RDS Defect Tracker.
RDS Defect Tracker - Benefits
1. Centralized Information System
2. Feedback mechanism Æ RPN values
3. Streamlines process for recording, tracking
and updating identified defects
4. Reduces uncertainty: Reliability Prediction
5. GUI interface, customized reports, alert
updates, and statistical analysis capabilities
6. Proposed neural network module – makes
reliability and design teams more proactive.
As previously mentioned, most commercial
software programs focuses on estimating reliability
or RPN values using MIL Standards or empirical
data. This may result in erroneous conclusions
regarding the system reliability. The RDS Defect
Tracker, on the other hand, uses defect data from
testing of the RDS, thereby providing a more
accurate measure of the system MTTF and
reliability.
Some of the limitations of the RDS Defect
Tracker are discussed below.
Data Accuracy – Requires accurate data for
performing the FMEA and predicting the
system reliability. Potential “noise” in the data
would have an adverse impact on the
reliability measures.
Scalability – As more data becomes available,
the overall response time of the RDS Defect
Tracker is expected to decrease, as a result of
the increasing complexity. Reconstructability
Analysis (RA) or similar techniques should be
employed to reduce this complexity by
monitoring only key variables that are
required to estimate the reliability or to
conduct an FMEA.
The following are the potential extensions to this
research:
Simulation of failure modes – A simulation of
the various failure modes can help analyze the
system performance under stress. An
accelerated stress testing module would be
beneficial to the design team to study the
impact of design changes.
Obtain field data – In order to obtain the
performance of the RDS in the field, the RDS
Defect Tracker should be integrated in the
RDS, sending any defect information to a
central data warehouse. This would help in
determining whether any updates to the design
or engineering changes are necessary.
The application of the RDS Defect Tracker is not
limited to the domain discussed in this paper. The
methodology presented can be applied to other
domain fields especially if introducing a new
product, or during a design for six sigma (or DFSS)
process.
REFERENCES
Bevilacqua, M., Braglia, M., Frosolini, M., Montanari, R.,
2005. Failure rate prediction with artificial neural
networks, Journal of Quality in Maintenance
Engineering, 11(3), pp. 279-294.
Brietler, A. L., Sloan, C. D., 2005. System reliability
prediction: Towards a general approach using a neural
network. In Proceedings, U.S. Air Force T&E Days.
American Institute of Aeronautics and Astronautics,
Inc.
Chen, K. 2006. Forecasting systems reliability based on
support vector regression with genetic algorithms
Reliability Engineering and System Safety, In Press,
Corrected Proof, Available [28 Feb 2006].
Coit, D. W., Jin., T., 2001. Prioritizing system-reliability
prediction improvements. IEEE Transactions on
Reliability, 50(1), pp. 17-25.
Price, C. J., Taylor, N. S., 2002. Automated multiple
failure FMEA. Reliability Engineering and System
Safety, 76, pp. 1-10.
Puente, J., Pino, R., Priore, P., Fuente, D., 2002. A
Decision support system for applying failure mode and
effects analysis. International Journal of Quality and
Reliability Management, 19(2), pp. 137-150.
Ramakrishnan, S., Sturek, J., Nagula, P., Srihari, K., 2006.
A systems approach to predict the reliability of a
robotic dispensing system. International Journal of
General Systems, pending submission.
Theije, S, M., Sander, P, C., Brombacher, A, C., 1998.
Reliability tests to control design quality: A case
study. International Journal of Quality and Reliability
Management, 15(6), pp. 599-618.
ICEIS 2007 - International Conference on Enterprise Information Systems
296
