
AN APPROACH FOR ASSESSING DESIGN SYSTEMS
Design System Simulation and Analysis for Performance Assessment
Richard Sohnius, Eyck Jentzsch, Wolf-Ekkehard Matzke
Cadence Design Systems, GmbH, Mozart str., 2, 85622, Feldkirchen, Germany
Vadim Ermolayev
Zaporozhye National Univ., 66, Zhukovskogo st., 69063, Zaporozhye, Ukraine
Keywords: Design system, assessment, simulation, PRODUKTIV+, PSI, performance, productivity, dynamic
engineering design process, ontology, multi-agent system, microelectronics.
Abstract: This position paper presents our work in assessing engineering design systems in the field of
microelectronics with respect to their performance and, more specifically, to productivity. Current
mainstream process assessment systems show deficiencies of the representation and analysis when dealing
with dynamic, self-optimizing processes. To overcome this, a project called PRODUKTIV+ has been
created with the goal to develop a new approach. This approach is to create a model of a design system and
simulate the colaborative behavior of the involved engineers using a system of cooperating, intelligent
software agents. The assessment of a design system is then done based on the detailed simulation results.
1 INTRODUCTION
It is well known that the design of microelectronic
devices gets more and more complex
1
(Moore 1965).
To keep design time and cost of such devices in
reasonable boundaries, the performance of the
system carrying out designs needs to be increased.
However, one can not improve what can not be
measured. Thus, a reliable and comprehensible way
to measure engineering design performance needs to
be developed.
Applying mainstream workflow and project
management tools has proven to be not suitable in
the domain of engineering design. Therefore, we
develop a new approach capable of modeling,
simulating and assessing design systems. This
approach is based on cooperating intelligent agents
for simulation and acts as a decision support tool by
allowing to measure productivity and other
performance related indicators and by helping to
improve performance by analysing bottlenecks and
weak spots of a design system.
1
Moore’s empiric law (interpretation): every 18 months the
processing power (of the product) doubles while cost holds
constant.
2 RELATED WORK
A considerable weakness of mainstream process
modeling approaches is the consequence of their
strength. Indeed, the majority of process modeling
frameworks provides sophisticated means to
describe a rich variety of process structures (vdAalst
et al 2003). They do it in a rigorous, but rather static
manner. Unfortunately, this fits only to well-defined
processes, for example in manufacturing. However,
design processes are of a different kind: They “…
are frequently chaotic and non-linear, and have not
been well served by project management or
workflow tools” (Neal , Smith & Butler 2001).
Commercial offerings like those of Numetrics
Management Systems, Inc
2
provide a benchmarking
service to assess development capabilities and
analyze the design cycle to identify which phases are
having the greatest impact on productivity and cycle
time performance. Users of this service receive a
quantitative assessment of their productivity, cycle
time performance, throughput, design process
quality, schedule performance and reuse strategy
effectiveness. However, Numetrix’s model of a
2
http://www.numetrics.com
231
Sohnius R., Jentzsch E., Matzke W. and Ermolayev V. (2007).
AN APPROACH FOR ASSESSING DESIGN SYSTEMS - Design System Simulation and Analysis for Performance Assessment.
In Proceedings of the Ninth International Conference on Enterprise Information Systems - AIDSS, pages 231-236
DOI: 10.5220/0002383902310236
Copyright
c
SciTePress
design process is based on the black box principle.
Their evaluation therefore uses only integral
characteristics. The weak point is that such an
approach does not allow “what-if” analysis reliably.
Other approaches like those described in (Jacome
1993), (Sutton 1997), (Gilmore & Kloul 2005),
(Heller, Schleicher & Westfechtel 2003) take into
account the nature of continuous process evolution
but neglect the source of this evolution: the human
beings involved in the process and pro-actively
driving it.
The approach presented in this position paper is
multidisciplinary and is aimed to integrate the strong
points of the mentioned R&D findings. It employs
the minimal necessary sub-set of business process
modelling primitives. Its strength lies in the fact that
it is focused on the dynamic and stochastic character
of design processes and uses AI planning and agent-
based approach in software implementation.
Thereby, it considers the impact of a human designer
and a design team on the process flow and its
productivity as very substantial.
The rest of the paper is structured as follows:
section 3 reports about the project frame while
section 4 describes the approach itself. Section 5
outlines potential use cases followed by the
conclusion and outlook in section 6.
3 PROJECT FRAME
To develop the approach and a prototype
implementation a joint research project between
AMD Saxony LLC, Robert Bosch GmbH, Infineon
Technologies AG and Cadence Design Systems
GmbH has been established. It is called
PRODUKTIV+
3
and is partially funded by the
German government. Additionally scientific
institutes are incorporated as subcontractors namely
IMS, OFFIS, metheval Jena, and Fraunhofer IIS.
The project uses results of the PSI
4
project (Matzke
2005).
The objective of PRODUKTIV+ is to develop a
comprehensible model and reference system for
acquiring performance indicators of microelectronic
design systems executing design processes. Since
those are highly creative and human driven
processes the approach puts strong emphasis on the
designers’ abilities and their interaction with the
design system and processes. Due to the dynamic
3
http://www.edacentrum.de/produktivplus
4
Performance Simulation Initiative, internal research project of
Cadence.
nature of design processes we adopted simulation as
the means of gaining detailed data. This allows not
only to analyse data retrospectively but also to
predict the behavior and performance.
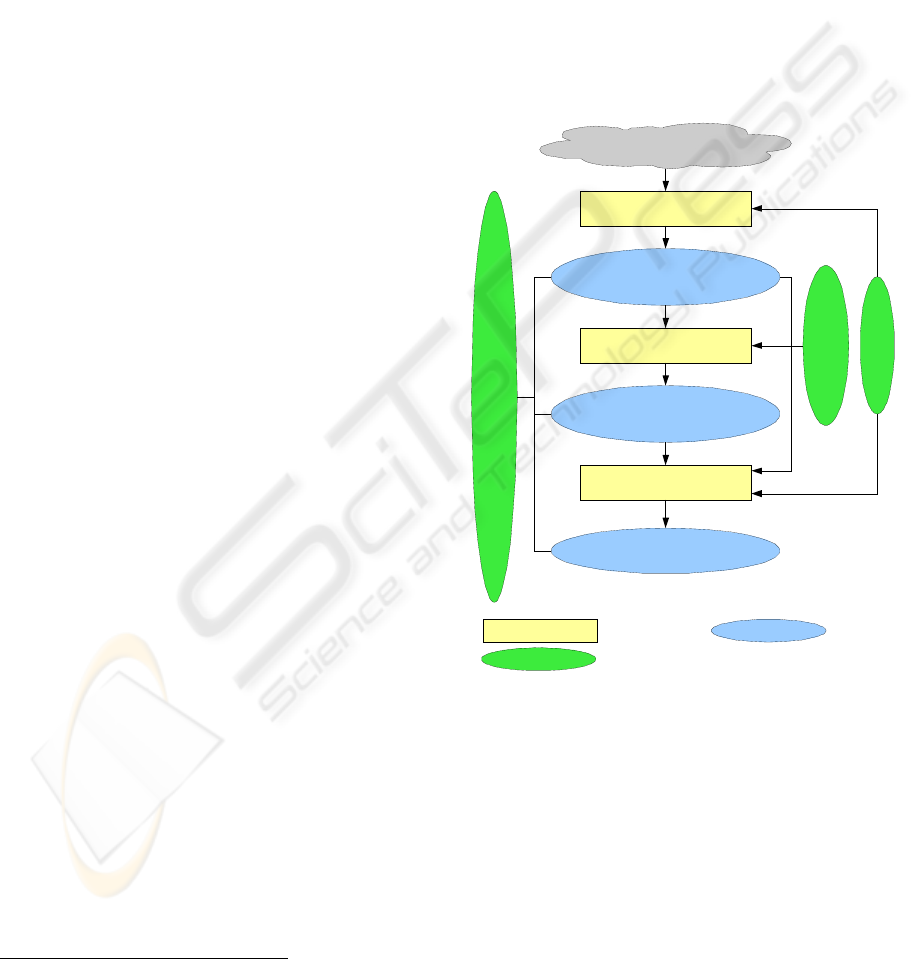
4 ASSESSMENT APPROACH
The approach comprises three steps. It uses the suite
of ontologies, the set of metrics, and dynamic
behavioral models (Figure 1). The description of the
ontology is given in the section 4.1, the metrics and
the behavioral models are described in section and
4.3.
ontology
real world
measurement
design system model
1
simulation
process record
evaluation
performance indicators
metrics
behavioral model
procedure data
static parts
1
the model contains the parameters in its instances
Figure 1: The PRODUKTIV+ Flow.
As in any assessment process, the first step is
collecting information. But unlike other approaches,
this information is more tied to the elements of the
design system. Therefore it is more detailed and not
directly related to the performance indicators. This
data is used to fill the model of the design system
with its parameters. The model consists of several
parts: an ontology specifying the elements, their
properties and relationships, a behavioral
specification describing the algorithmic parts of the
model and the metrics specification.
ICEIS 2007 - International Conference on Enterprise Information Systems
232

At the next step, the design system with the
given parameters is simulated and the parameters are
adjusted so that the results fit observable results and
properties. With a simulation model calibrated this
way it possible to gain very detailed data about the
process (the process record).
In the last step this record together with the
initial data can be analyzed and evaluated resulting
in the desired performance indicators and measures.
4.1 Model
A characteristic feature of the model of a design
process in PRODUKTIV+ is the way it addresses
the dynamic properties of a process attempting to
come closer to the reality in this application domain.
The aim is to model processes which are self-
adjusting, self-configuring, and self-optimizing at
run time (Ermolayev et al 2006a). The model is
based on the notion of a Dynamic Engineering
Design Process (DEDP). One of the central points in
modeling a DEDP is to adequately represent a
designer as a locus of a goal-directed behavior and a
design team as a dynamic social structure. A
software agent can be naturally used as an
appropriate model for a designer and a multi-agent
system (MAS) as a model for an adaptable social
structure like a design team. This is why
PRODUKTIV+ uses agent-oriented models in its
framework.
A DEDP is understood as a weakly defined
engineering design workflow. It aims to achieve its
goal (the design artifact comprising a certain set of
its representations) in an optimized way in the terms
of result quality and gained performance. The
following entities are involved in the process: actors,
who form design teams and collaboratively do the
work in the flow; activities which are the atomic
parts of a workflow defined by the technology used
in the house; tasks which are the representations of
the hierarchical clusters of activities; and design
artifacts which are the results of engineering design
activities. Hence, activities are defined statically and
form the “basket” of activities, are uniformly
understood and used by any actor and, therefore,
may be considered generic. Another static shared
“basket” is the one of generic tasks (below). Other
elements may only “become apparent” at run time.
An executable activity differs from a generic one
by having particular associations to the assigned
actor and the developed design artifact.
Tasks are also distinguished as generic and
performed ones. A generic task is a shared static
template defining a typical transformation of a
design artifact. A performed task is subjectively
dynamic because of its relationship to the specific
actor who manages the task assigned at run time.
A task is the model of the emerging hierarchical
structure of a DEDP or the part of a DEDP. It may
contain tasks or wrap a single activity. The main
purpose of a task is to arrange the assignment of its
sub-tasks or the execution of the wrapped activity.
By formalizing the above we denote the model of
dynamic cascade decomposition of tasks and,
ultimately, of a DEDP.
The number of activity loops is not defined in
advance. It depends on the quality checks at
intermediate steps. Changing the number of activity
loops may cause the changes in its duration. In turn,
it may cause the delays of the dependent tasks and
activities with associated penalties for, e.g., deadline
violation.
The duration of activity execution is not defined
in advance either. Different actors possess different
capacities to be spent for an activity at a certain
time. They may perform the same activity with
different efficiency depending on their ability. An
activity may remain idle while waiting until the pre-
conditions have been triggered. Idle state duration
can’t be computed in advance because the
preconditions may be formed by the other activities
executed by other actors.
Mentioned factors provide certain degrees of
freedom
5
in DEDP planning, re-planning,
scheduling, re-scheduling, and execution. A DEDP
is never rigidly planned before it starts. The
decisions on how to continue its execution are taken
each time it reaches a certain state in the state space.
These decisions are taken by the design team
members through reaching agreements in
negotiations (Ermolayev & Keberle 2006).
The described model has been formalized in the
suite of PRODUKTIV+ ontologies v.1.0 extending
PSI Ontologies suite v.1.6 (Ermolayev et al 2006b).
These ontologies have been used to formalize the
test cases (Sohnius et al 2006) and feed the
simulation prototype (Samoylov et al 2006).
Furthermore, they provide the formal specification
of the domain used in agent behavior scripts, give a
clear definition of the terms of the domain, and serve
as exchange format with the partners.
4.2 Measurement
In order to be able to do a simulation, detailed
information on the design team, tools, resources, and
of course the product to be designed are necessary.
Furthermore, as much information as possible on the
5
It should be noted here that this freedom implies more
complications in planning, scheduling and the necessity to deal
with finer grained DEDP model.
AN APPROACH FOR ASSESSING DESIGN SYSTEMS: Design System Simulation and Analysis for Performance
Assessment
233

course of the project is required to be able to
calibrate the simulation.
Data on the first test cases has been collected
manually and with some semi-automated export
functionality (Sohnius et al 2006). Experimental
approaches on gaining large amounts of data
automatically from process logs and license servers
are currently tested. Furthermore, a first GUI-based
software tool allowing easier and more comfortable
collection of data that cannot be extracted
automatically has been developed.
Complete testcases collected so far include two
simple fictive testcase on a digital and an analog
design, one fictive testcase of a mixed signal MP3
player chip, and one real world case of a digital
design (Sohnius et al 2006).
4.3 Simulation
The next step is to simulate the course of the project.
The goal of the simulation is to achieve a self-
regulating system that creates reasonable project
plans including schedules and is capable of pro-
actively reacting to external influences as a team of
designers would do. The simulation of the execution
of the plan is based on the estimations of the
duration and achieved quality of each activity. The
natural way of simulating such a group of
cooperating humans is a system of cooperating
software agents – a multi agent system (MAS)
(Samoylov et al 2006). Every agent represents an
engineer and they collaborate to accomplish the
project. Whereby the roles an agent can play are not
restricted to engineering and design work but also
include managing activities like a project or task
manager.
First, the MAS has to create a plan - meaning a
work breakdown structure, a resource assignment,
and a schedule. Whereby, as mentioned before, the
WBS is created by assembling the known activities
to reach the project goal. A partial view of the
resulting activity graph is shown in Figure 2. Bright
activities and states were found to be a less optimal
choice and have been removed automatically. At the
next step, the execution of this plan is simulated and
the MAS reacts dynamically to any influence
disturbing the plan (section 5.3).
Figure 2: Partial WBS Graph.
Before the simulation can be used to gain the
desired data, it needs to be calibrated. This is done
by running the simulation with the parameter values
collected in advance and comparing the results to the
course of the real project. Experience shows that the
collected data usually contains mistakes and
inconsistencies which implies that the simulation is
unable to complete or completes with senseless
results. Another reason for larger deviations is the
existence of external influences which occured in the
real project but were forgotten in the simulation
setup - e.g. events which result in changes of the
objectives, of the staff or of the available resources
in the course of the project. One more reason might
be that not all company policies, restricting the
engineers’ choices, were formalized. The parameters
must be corrected and completed until the simulation
completes with results close to the original project.
Once the simulation is calibrated, the record of
the simulation can be used to gain very detailed
information on the course of the project. While this
information is of course only a “most likely”
estimation, it is still information that would require
tremendous effort to collect in the real world or is
even impossible or forbidden to acquire.
Furthermore, the very same system can be used for
predictive simulations and therefore allows what-if
analyses (section 5.2).
So far, an initial simulation with the most
important features has been implemented based on
the first model (Samoylov et al 2006). It has been
tested using the aforementioned test cases and
showed promising results: The system came up with
a consistent and complete plan. It decomposed the
design correctly and chose appropriate activities to
reach the project goal. Furthermore, it proposed a
resource assignment and a schedule. All of that was
reviewed by the original project leader and
considered reasonable and acceptable. The
simulation also reacted correctly to changes to the
parameters like changes in the staff, the structure or
the complexity of the design.
ICEIS 2007 - International Conference on Enterprise Information Systems
234
5 ASSESSMENT
Using the collected information supplemented with
the records of the simulation several different
evaluations and assessments are possible.
5.1 Performance Assessment
Our foremost goal is the assessment of the
performance of a design system. For example, to
assess productivity, we compare the inputs (costs)
with the output which is computed using the
complexity of the design, its achieved quality, and
the level of abstraction crossed.
Other important indicators are development time
respectively time-to-market, development cost,
utilization, and more.
Thanks to the high level of detail available, we
can do that not only for the whole design but also for
certain design phases and/or certain parts of the
design. Comparisons of these numbers can be used
to identify “weak spots” where there is more
potential for the improvement of the gained
performance.
5.2 What-if Analysis
What-if analysis is the approach to make the
mentioned “weak spots” more efficient (or
“performative”). Initial experiments with the
prototype simulation tool (Samoylov et al 2006)
proved to be promising in that. It is possible to
change some of the inputs of the simulation and
iterate it to see which effect the changes will have.
Such an analysis allows for ROI assessments like
“how much do I gain if I buy this new computer?”
and more complex short-term/mid-term analyses like
“how much do I loose in the beginning if I switch to
that new tool suite?”, “when will I have a break
even?” (with respect to productivity) and “how
much do it gain once the tools are fully integrated?”.
These analyses can also help with project related
decisions like “which technology to use?” or “design
the part in house or buy an available IP
6
?”.
Another potential use case is feasibility studies.
Once the tool is fed with the information about the
design system, one can also make estimations about
the feasibility of different kinds of design. The
simulation might either fail with the agents reporting
that they were unable to come up with a reasonable
plan due to the lack of some skills or tools or in the
6
IP stands for “Intellectual Property” and denotes
predesigned modules which can be inserted into designs.
better case, they will present a rough estimate of the
project with respect to the company’s specific
profile. This estimate can then be analyzed like a
normal replay and weak spots and critical issues can
be dealt with upfront.
5.3 Random Simulation
Having an average estimate of the course of a future
project is nice but it does not tell how safe or risky
this plan is. In real life, there are too many
influences on a project to give a 100% precise
prediction. Hense, by introducing a similar
uncertainty into the simulation, varying activity
lengths and adding random events like specification
changes and change of staff, it is possible to estimate
how stable the plan is regarding these disturbing
influences. In order to do that, a whole series of
random simulation has to be performed (e.g. using
Monte Carlo method) and the results have to be
analyzed statistically.
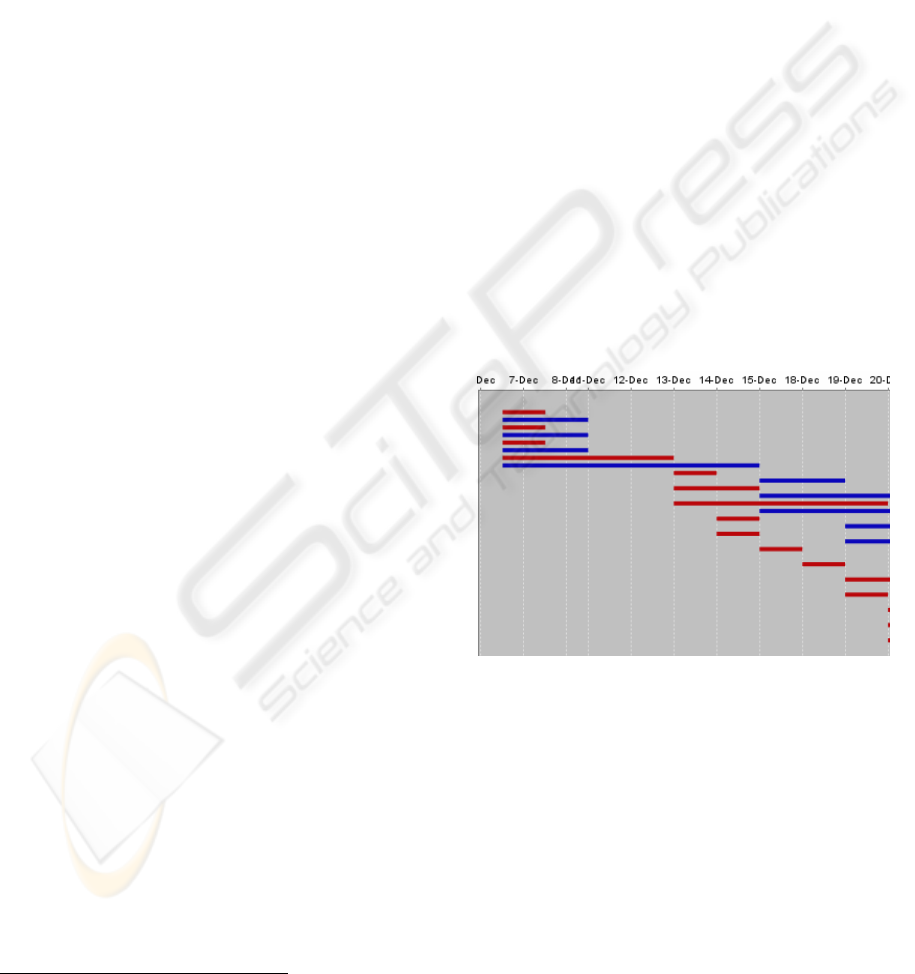
A small fraction of the result of such a random
simulation run can be seen in Figure 3. The brighter
bars show the planned execution time and the darker
ones the time in the random simulation.
Figure 3: Simulation Result.
5.4 Quality Management
Last but not least, the system can help with quality
management. The simulation also includes quality
estimations and allows therefore answering
questions like: “what quality will my product most
likely have?”, “where can get the most improvement
in quality?” or “where can I save some time or costs
with minimal impact on quality?”
AN APPROACH FOR ASSESSING DESIGN SYSTEMS: Design System Simulation and Analysis for Performance
Assessment
235

5.5 Work Done So Far
Some basic indicators like development time, total
effort, utilization, and others have been
implemented. More complex evaluations are not
implemented yet as some of their inputs are not fully
present at this time.
Simulations of the same project with different
parameters have been conducted and the results have
been compared using the aforementioned indicators.
The results matched the expectations.
Furthermore, some simple randomized
simulations have also been conducted to show the
feasibility of such an analysis.
6 CONCLUSIONS
While the development and implementation of some
important aspects is not complete yet, the results are
already promising. We have shown that the
approach in general is feasible.
Next steps obviously include the completion of
the model and its implementation, as well as
improving the pool of data to allow for better
evaluation.
Crucial to the success of this approach will be
the amount of data required to get reasonable results
and the effort that has to be spent in order to gain
this data. A final answer to that question can only be
given after the model is complete, implemented, fine
tuned, and analyzed and the efforts on automatic
data gathering are also completed.
REFERENCES
Ermolayev, V., Jentzsch, E., Karsayev, O., Keberle, N.,
Matzke, W.-E., Samoylov, V., Sohnius, R. (2006a).
An Agent-Oriented Model of a Dynamic Engineering
Design Process. In: Kolp, M.et al. (Eds.): Agent-
Oriented Information Systems III. 7th Int. Bi-Conf.
Workshop, AOIS 2005, Utrecht, Netherlands, Jul. 26,
2005, and Klagenfurt, Austria, Oct. 27, 2005. Revised
Selected Papers, 168-183
Ermolayev, V., Jentzsch, E., Keberle, N., Sohnius, R.
(2006b). Performance Simulation Initiative. The
Family of PSI Ontologies v.1.6. Reference
Specification. Technical Report PSI-ONTO-TR-2006-
4, 26.07.2006, VCAD EMEA Cadence Design
Systems, GmbH, 78 p.
Ermolayev, V., Keberle, N., (2006). A Generic Ontology
of Rational Negotiation. In: Karagiannis, D., Mayr,
H.C. (Eds.): Information Systems Technology and its
Applications. 5-th Int Conf ISTA'2006, May 30 – 31,
2006, Klagenfurt, Austria, 51-66
Gilmore, S., Kloul, L. (2005). A Unified Tool for
Performance Modelling and Prediction, Reliability
Engineering and System Safety, Elsevier Science,
vol.89, n.1, pp:17-32, July 2005
Heller, M., Schleicher, A., Westfechtel, B. (2003). A
Management System for Evolving Development
Processes. Integrated Design and Process Technology,
IDPT-2003
Jacome, M. F. (1993). Design Process Planning and
Management for CAD Frameworks. Dissertation at the
Carnegie Mellon University, Pittsburgh, Pennsylvania
1993
Matzke, W.-E. (2005). Engineering Design Performance
Management – from Alchemy to Science through
ISTa. In: Kaschek, R., Mayr, H.C., Liddle, S. (Eds.)
Proc. 4
th
Int. Conf on Information Systems
Technology and its Applications (ISTA’2005), 23-25
May 2005, Palmerston North, New Zealand, 154-179,
2005
Moore, G.E.(1965). Cramming more components onto
integrated circuits. Electronics, Vol 38, No 8, April 19,
1965, pp. 114–117
Neal, D., Smith, H. and Butler, D. (2001). The evolution
of business processes from description to data to smart
executable code – is this the future of systems
integration and collaborative commerce? Research
Services Journal: March 2001, 39-49
Sohnius, R., Ermolayev, V., Jentzsch, E., Keberle, N.,
Matzke, W.-E., Samoylov, V. (2006). Managing
Concurrent Engineering Design Processes and
Associated Knowledge. In: Ghodous, P., Dieng-Kuntz,
R., and Loureiro, G. (Eds.): Leading the Web in
Concurrent Engineering. Proc. 13th ISPE Int Conf on
Concurrent Engineering: Research and Applications,
18 - 22 Sept., Antibes, French Riviera, IOS Press,
Series: Frontiers in AI and Applications, Vol. 143, pp.
198-205, 2006
Samoylov, V., Gorodetsky, V., Ermolayev, V., Jentzsch,
E., Karsayev, O., Keberle, N., Matzke, W.-E., and
Sohinus, R. (2006). Agent-based Prototype of the
Dynamic Engineering Design Process Performance
Management System (DEDP-PMS). In: Brewka, G.,
Coradeschi, S., Massa , P., Perini, A., Tatar, M.,
Traverso, P. (Eds.) ECAI 2006 Systems
Demonstrations . ECAI 2006, Riva del Garda, Italy ,
Aug. 28 – Sep. 1 , p. 37-38
Sutton, P.R. (1997). A Framework and Discipline
Independent Approach to Design System
Management. Dissertation at the Carnegie Mellon
University, Pittsburgh, Pennsylvania, 1997
van der Aalst, W.M.P., ter Hofstede, A.H.M.,
Kiepuszewski, B., and Barros, A.P. (2003). Workflow
Patterns. Distributed and Parallel Databases, 14(1):5-
51, 2003
ICEIS 2007 - International Conference on Enterprise Information Systems
236
