
DIRECTIONAL SPECTRUM MODELLING IN INHOMOGENEOUS
FORESTS AT 20 AND 62.4 GHZ
Telmo R. Fernandes, Rafael F. S. Caldeirinha
ESTG-Leiria/Institute of Telecommunications-DL
Alto do Vieiro - Morro do Lena, 2411-911 Leiria, Portugal
Miqdad O. Al-Nuaimi, J
¨
urgen Richter
Radiowave Propagation and System Design Research Unit, School of Electronics, University of Glamorgan
Treforest, CF37 1DL, United Kingdom
Keywords:
Radiative Energy Transfer, Micro and Millimetre Wave Propagation, Vegetation, Foliage Attenuation.
Abstract:
This paper presents a radiowave propagation model for inhomogeneous forests based on the Radiative Energy
Transfer theory (RET) model. This model, which is a discretised version of the RET, is able to simulate
the behaviour of radiowaves inside a forest which contains various types of vegetation and free space gaps.
The forest is divided into non-overlapping square cells, each one with different propagation characteristics.
The propagation properties of each cell rely on specific propagation parameters, which are extracted from
vegetation using an appropriate measurement method which is also described. The model performance is
assessed through comparison between predicted values and directional spectrum measurements carried out in
an isolated inhomogeneous forest at 20 and 62.4 GHz. This forest, located in South Wales, is formed by 6
different species of trees of various sizes and leaf types. The measurements were performed with the trees
in-leaf.
1 INTRODUCTION
The growth of fixed and mobile radio networks ex-
perienced in the last decades, has led to an increased
need for cost effective, and enhanced utilisation of the
available bandwidth and system coverage. This en-
hancement can be accomplished through a more ef-
ficient use of the available radio spectrum. A more
efficient use of the radio spectrum relies on accurate
radio planning tools which allow system planners to
effectively predict the behaviour of their radio com-
munication systems in terms of coverage and interfer-
ence on existing systems.
The radiowaves interact with the obstacles and sur-
rounding environment present in the radio path cre-
ating undesirable effects which need to be accurately
modelled. From these obstacles, vegetation is very
likely to be present in sub-urban and rural environ-
ments, causing degradation in the performance of the
radio systems. To this extent, the understanding of the
interaction between radiowaves and vegetation media
is very important.
Various propagation models have been applied to
vegetation with different degrees of success (Rogers
et al., 2002). From these, the Radiative Energy Trans-
fer theory (RET) has yielded good results for micro-
and millimeter wave frequencies (Rogers et al., 2002;
ITU-R, 2005). In (Rogers et al., 2002), results from
an extensive measurement campaign are used to com-
pare the predictions of the RET with actual measure-
ment data in the 1 to 60 GHz frequency band. This
work has established a generic model for radiowave
propagation in vegetated areas which was recently ap-
pended to the ITU-R recommendation in force (ITU-
R, 2005). Although this model is based on three
different propagation mechanisms, it is reported that
the scattered component, which is modelled with the
RET, is dominant in terms of the received signal level.
The first known application of the RET theory to
model the radiowave propagation in vegetation me-
dia was reported in (Johnson and Schwering, 1985)
which is based on the RET modelling presented in
(Ishimaru, 1997). Both of these RET formulations
present some approximations which limit the applica-
bility of the model, e.g. the model considers a ho-
mogeneous medium; the medium is not physically
limited and special geometry conditions must be met.
The vegetation media is normally inhomogeneous in
nature as leafs tend to grow more in the periphery of
the forest due to the increased sunlight exposure. An-
other limitation is that vegetation normally appears in
limited or isolated groups, and forest volumes are nor-
164
R. Fernandes T., F. S. Caldeirinha R., O. Al-Nuaimi M. and Richter J. (2006).
DIRECTIONAL SPECTRUM MODELLING IN INHOMOGENEOUS FORESTS AT 20 AND 62.4 GHZ.
In Proceedings of the International Conference on Wireless Information Networks and Systems, pages 164-170
Copyright
c
SciTePress

mally limited by the ground and the top of the vege-
tation.
To overcome the issues presented above, a discre-
tised version of the RET (dRET) was presented in
(Didascalou et al., 2000). A development of this
model as well as a complete assessment was per-
formed in (Fernandes et al., 2005) using an idealised
scaled-down version of a forest formed by 16 Ficus
Benjamina plants inside an anechoic chamber at 20
and 62.4 GHz.
In order to apply the dRET, the vegetation volume
is divided into non overlapping square cells each one
presenting distinct propagation characteristics. The
signal flow in each of the cells is subsequently calcu-
lated using an iterative algorithm which evaluates the
interactions between the different cells.
In this paper, the dRET formulation is used to sim-
ulated the behaviour of a full scale outdoor forest
formed by 6 different species of trees. The assess-
ment of the model is performed by comparing the pre-
dicted values with the actual measurement data ob-
tained from outdoor measurements at 10 locations in-
side the test forest.
In section 2, the RET based scattering propagation
models which are used during this paper as well as the
differences between the original RET and its discre-
tised version are presented. The model input propaga-
tion parameters are also described. The site specifics,
including both the geometry and the tree characteris-
tics, used to validate the proposed model is also pre-
sented. The experimental procedures used to extract
the vegetation parameters as well as the overall model
validity in terms of excess attenuation caused by tree
is also outlined. Section 4 presents and discusses the
measurement results. Finally in section 5 the conclu-
sions of the paper are presented.
2 THE SCATTERING
PROPAGATION MODELS
2.1 The Radiative Energy Transfer
(RET)
The RET models vegetation as a homogeneous
medium randomly filled with similar scatterers,
which are characterised by the following set of pa-
rameters:
• The Extinction Coefficient or k
e
. This parameter
specifies the amount of energy which is lost due to
absorption and scattering;
• The Scattering Coefficient, k
s
, which specifies the
scattered energy;
• The scatter directional profile p (ˆs, ˆs
′
), known as
Phase Function (Ishimaru, 1997), with ˆs
′
and ˆs
representing the directions of the energy entering
and emanating from each scatterer, respectively.
The phase function is normally modelled according to
Eq. 1 (Johnson and Schwering, 1985; Ishimaru, 1997)
which represents a Gaussian function superimposed
to an isotropic background level:
p (γ) = α
2
β
2
e
−
(
γ
β
)
2
+ (1 − α ) , (1)
where α is the ratio between the forward lobe power
and the total power of the phase function, β represents
the half power beamwidth of the forward lobe and γ
is the angle subtended by ˆs and ˆs
′
.
The RET equation is normally expressed in its dif-
ferential form, presented in Eq. 2.
dI
ds
= −k
e
I + k
s
Z
4π
p (ˆs, ˆs
′
)Idw, (2)
where the left hand side (LHS) describes the spa-
tial variability (i.e. derivative) of intensity over one
scatterer, while the first term on the right hand side
(RHS) accounts for the reduction in intensity due to
the absorption and scattering. The second term on
the RHS represents the increase of intensity resulting
from the scattering contributions of surrounding scat-
terers (Johnson and Schwering, 1985). In (Johnson
and Schwering, 1985), the overall intensity I is di-
vided into two different intensities: the reduced inten-
sity, I
ri
and the diffuse intensity I
d
. I
ri
is the atten-
uated incident intensity whereas I
d
accounts for the
contributions from incoherent scattered components
inside the vegetation medium.
2.2 The Dret Formulation
The discrete RET (dRET) was originally proposed by
(Didascalou et al., 2000), as a method to overcome the
RET limitations in terms of applicability to isolated
vegetation volumes. In the dRET modelling, the veg-
etation volume is divided in non-overlapping square
cells and an iterative algorithm is used to gather all
the interactions between these primary cells, allowing
for the computation of the intensity across the entire
tree formation. This approach of splitting the vege-
tation in discrete elementary volumes, allows one to
assign different scattering parameters to every cell,
consequently enabling an inhomogeneous vegetation
volume to be more accurately represented. This is de-
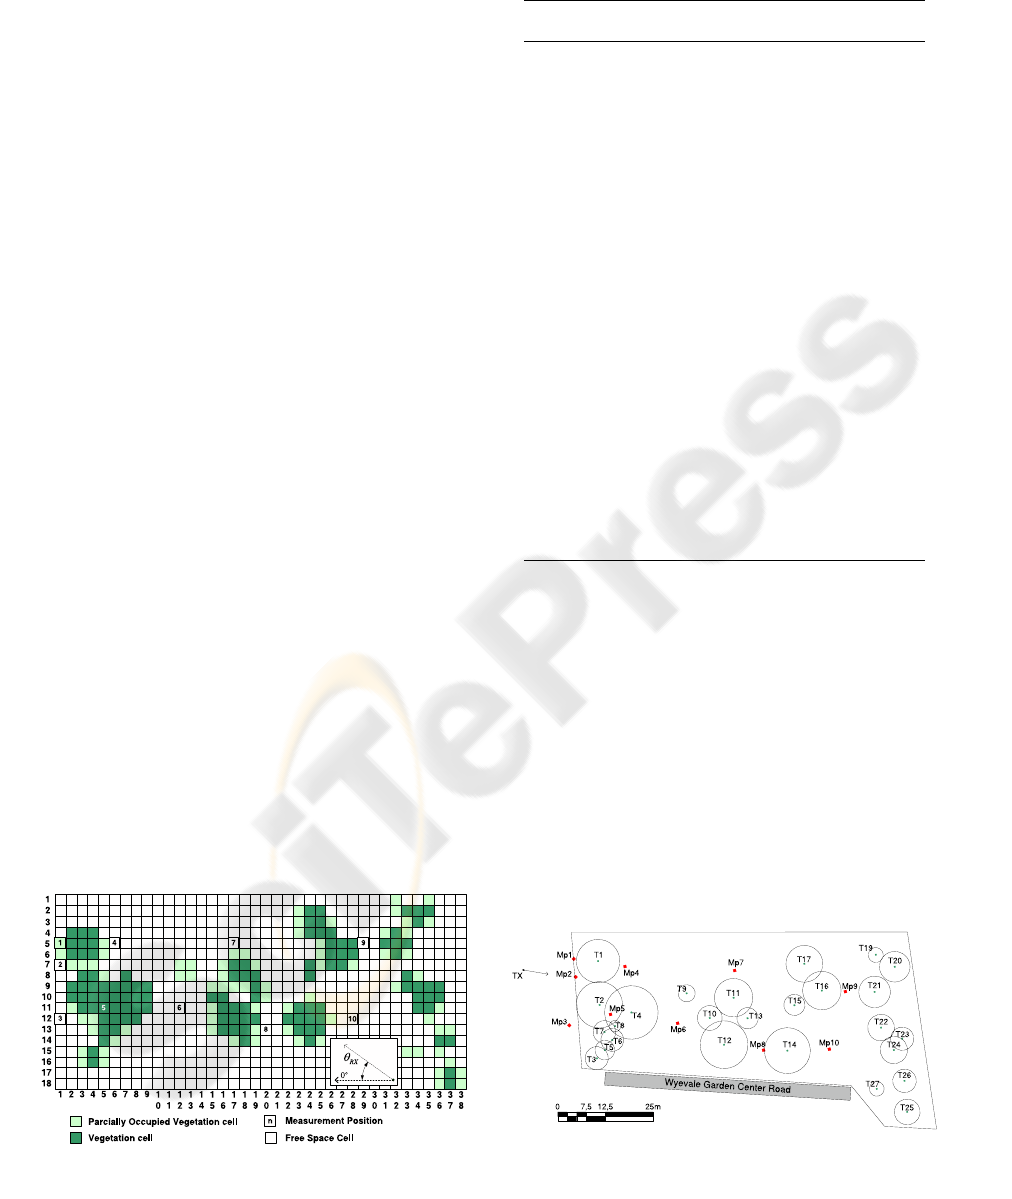
picted in Fig. 1.
The dRET approach presented in (Fernandes et al.,
2005) and used here, comprises 4 major improve-
ments compared to the algorithm given in (Di-
dascalou et al., 2000). These are summarised as fol-
lows: (i) the improved dRET version yields results
for angles other than those which are integer multi-
ples of 45
◦
; (ii) it accounts for the effect of the receiv-
ing antenna radiation pattern; (iii) the dRET differen-
tial equation is more readily solved, which means that
piecewise linear approximation is no longer needed,
so that the algorithm can cover larger cell sizes; and
(iv) the cell parameters can be defined individually,
thus allowing one to define inhomogeneous scenarios.
3 EXPERIMENTAL PROCEDURE
An experimental program was designed to evaluate
the performance of the dRET model in a real outdoor
environment. This program involved two main tasks:
the dRET parameter extraction and the evaluation of
the excess attenuation caused by trees at several loca-
tions inside the test forest.
3.1 Description of the Measurement
Site
The measurement site is located in the North-East of
Cardiff in South Wales. The test forest is an isolated
group of trees formed by 6 different species. To com-
pletely characterise the test forest, precise locations of
each tree and the mean canopy diameters were mea-
sured using a theodolite. Using this data, a 2D rep-
resentation of the forest is presented in Fig. 2. The
transmitter location (TX) and the direction where it
was pointed in the measurements are also presented.
The red dots which are labeled Mpx, represent the re-
ceived signal measurement locations. The tree species
present in the test forest as well as the dimensions of
the trees are presented in Table 1.
For each of the species, the leaf size parameters
were measured. These mean sizes are presented in
Table 2.
Figure 1: 2D cell structure.
Table 1: Tree species of Wyevale Garden Center site.
Canopy Tree
Tree Label Common Name Diameter (m) Height (m)
T1 Oak 11.4 10.9
T2 Oleaster 12.1 16.5
T3 Ornamental Cherry 6.1 3.5
T4 Oleaster 14.0 17.7
T5 Ornamental Cherry 5.2 3.5
T6 Ornamental Cherry 6.0 3.5
T7 Ornamental Cherry 6.0 3.5
T8 Ornamental Cherry 3.0 3.0
T9 Silver Birch 4.5 8.4
T10 Silver Birch 6.5 6.4
T11 Silver Birch 10.0 10.0
T12 Oleaster 12.5 15.6
T13 Silver Birch 5.6 5.5
T14 Oleaster 12.0 15.0
T15 Oak 5.6 2.5
T16 Oak 10.1 7.2
T17 Gean 9.6 7.3
T19 Pecan 3.9 8.9
T20 Oak 8.0 9.6
T21 Pecan 8.3 5.2
T22 Pecan 7.0 7.0
T23 Oak 6.1 7.8
T24 Oak 7.2 6.8
T25 Pecan 6.8 13.0
T26 Pecan 6.2 14.3
T27 Pecan 3.9 4.3
3.2 Directional Spectrum
Measurements
To evaluate the excess attenuation caused by the vege-
tation, the RX antenna was placed at each of the loca-
tions shown in Fig. 2 and the directional profile of the
received signal was evaluated. This evaluation was
performed positioning the receiver antenna at 5.5 m
high, which represent approximately one half of the
mean canopy height of the trees which form the test
forest. At each location, the RX antenna was rotated
clockwise 360
◦
around its vertical axes (θ
RX
) in 1
◦
Figure 2: Scaled drawing of the Wyevale Garden Center test
site.
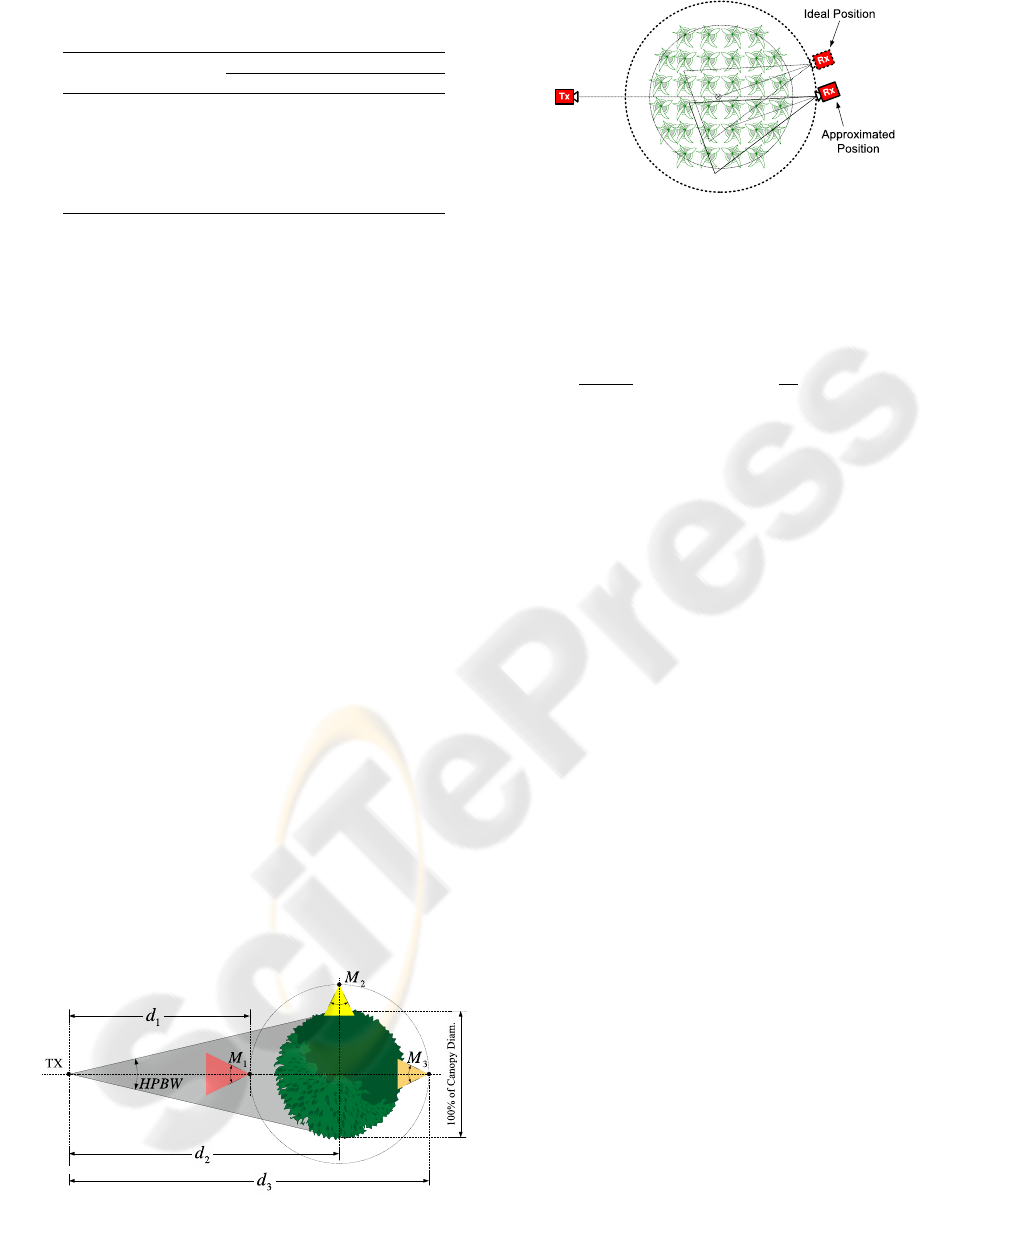
Table 2: Tree leaf sizes of Wyevale Garden Center site.
Leaf Size
Common Name Length (cm) Width (cm)
Oak 13 8
Oleaster 9 0.8
Ornamental Cherry 10 6
Silver Birch 4 2.5
Gean 15 6
Pecan 9 3
incremental steps.
The TX antenna was placed outside the forest in
the position shown in Fig. 2 at 13 m distance from
the air to vegetation interface. To achieve an almost
uniform illumination of the interface, very broad 50
◦
(10 dBi) half power beamwidth antennas were used at
both test frequencies. At the receiver side, high gain
directional antennas were used. At 20 GHz the RX
antenna was of the lens horn type with 33 dBi and 4
◦
of HPBW, while at 62.4 GHz a lens horn antenna with
36 dBi and 2.8
◦
of HPBW was used.
3.3 Parameter Extraction and
Scaling
The dRET input parameters must be extracted from
specific measurement data. This data is obtained
from received signal measurements in specific loca-
tions around the tree as explained in Fig. 3. The dis-
tances d
1,2,3
were chosen so that 100% of the canopy
width could be illuminated within the HPBW of the
TX antenna, and at the same time, the RX antenna
was placed as close as possible to the tree canopy.
At each of the 3 measurement locations presented in
Fig. 3 (labeled M
n
) the receiver antenna was rotated
around the vertical axes in a ±45
◦
range in 1
◦
steps.
The extraction of k
e
was based on the measurement
of the insertion loss caused by the tree, and conse-
quently relied on measurements M
1
and M
3
. The ra-
Figure 3: Parameter extraction measurement setup.
Figure 4: Approximated method to measure parameter β.
tio between the maximum received powers at these
locations was used to calculate k
e
using Eq. 3.
P
3 max
P
1 max
= e
−k
e
(d
3
−d
1
)
d
3
d
1
2
, (3)
where P
1 max
and P
3 max
are the maximum receiver
powers at positions M
1
and M
3
, respectively, and d
n
is the distance between the TX and the n
th
measure-
ment location in meters.
To extract the phase function parameters α and β, a
modified version of the re-radiation indoor measure-
ment procedure (Fernandes et al., 2005) was used.
This modified version overcomes some of the inac-
curacies reported in (Richter et al., 2002) and is sim-
pler to carry out. The β optimisation is based in mea-
surement M
3
, where the ideal measurement position
is replaced by a more convenient approximated po-
sition, as explained in Fig. 4. The optimisation of
α uses the side scatter level of the tree obtained from
measurement M
2
, which is subsequently used to opti-
mise α in Eq. 1. Finally, k
s
is extracted by modelling
the tree as a single dRET cell. As there are no in-
teractions involved between cells a simple version of
the dRET diffuse intensity equation (Fernandes et al.,
2005) is used to optimise k
s
, providing the measured
side scatter level.
The parameter extraction was performed for 5 of
the 6 species present in the test forest. The trees cho-
sen to carry out the parameter extraction were: T
1
,
T
3
, T
11
, T
12
and T
17
. These were chosen due to their
location at the border of the forest, thus avoiding the
possible contamination of measured results caused by
interference from the other species. The extracted pa-
rameters are presented in Tables 3 and 4 for 20 and
62.4 GHz respectively. Some parameters were im-
possible to calculate, specially for the larger trees, due
to the high attenuation of the coherent signal compo-
nent. In these cases average parameter values were
assigned to the corresponding trees.
To limit the stair case error due to the discretisation
of the forest, while maintaining a reasonable compu-
tational time, a 2.5 m vegetation cells division was
used, as depicted in Fig. 1. In order for the phase
0 50 100 150 200 250 300 350
−60
−50
−40
−30
−20
−10
0
RX antenna rotation angle (deg)
Excess attenuation (dB)
E
RMS
= 10.8 dB
Measured Signal
Predicted Signal
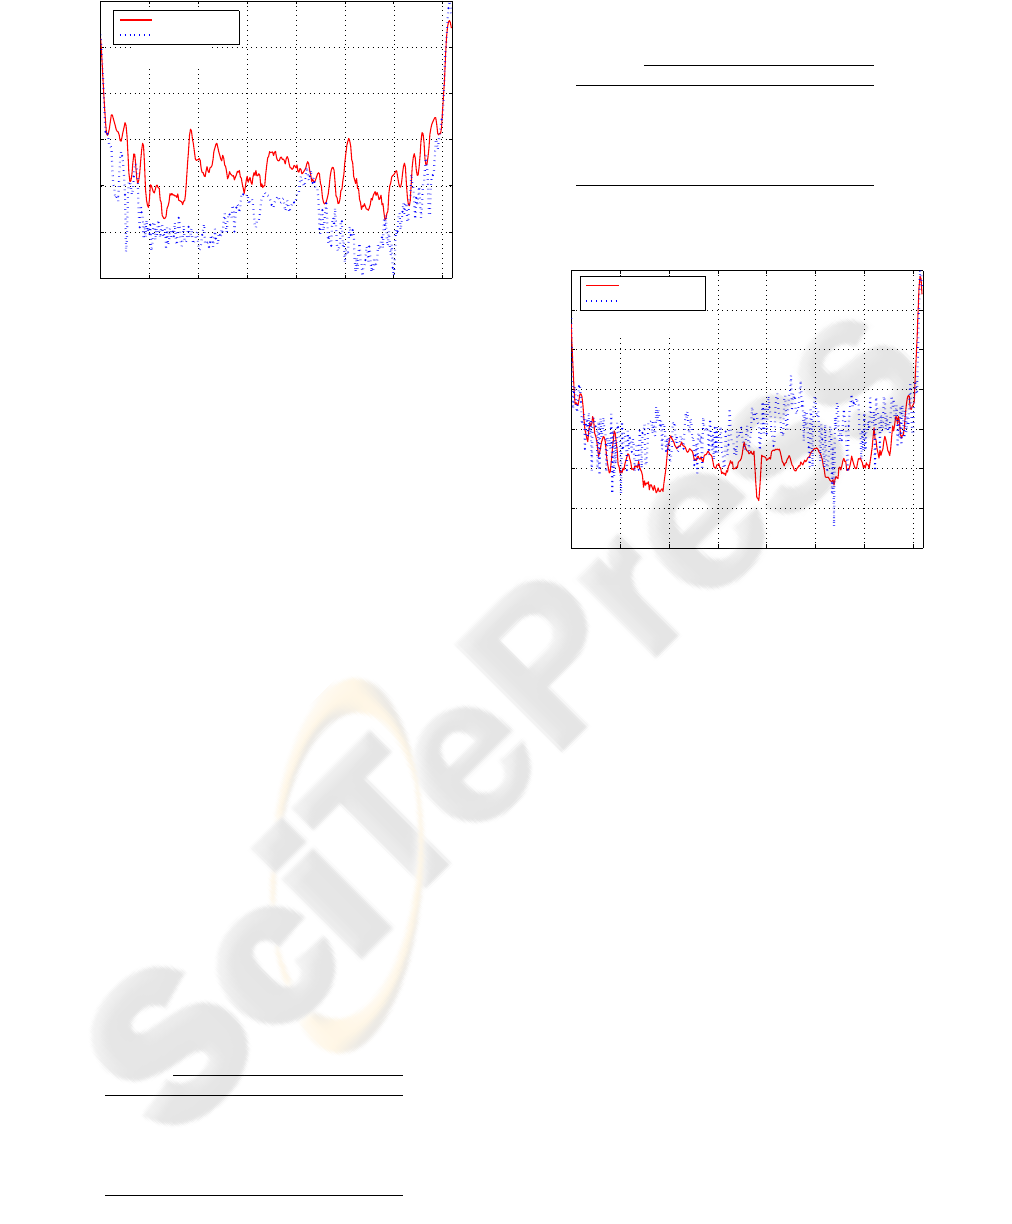
Figure 5: Measured and predicted signals in M P
2
at 20
GHz.
function parameters to remain valid, these have to be
adapted to the new vegetation volumes by performing
an appropriate scaling. The scaling method used here
is explained in (Fernandes et al., 2006), which sug-
gests a linear behaviour of α and β with the variation
of the vegetation volume.
4 MEASUREMENT RESULTS
The assessment of the dRET propagation model re-
sults was performed comparing the predicted results
with directional spectrum measurements were carried
out at 10 locations inside the forest according to the
procedure explained before. The measured excess at-
tenuation can subsequently be compared with the pre-
dictions calculated by the dRET algorithm for the test
forest depicted in Fig. 2 when modelled with the cell
structure presented in Fig. 1.
A comparison between the measured received sig-
nal and the predicted signal values obtained at M P
2
is presented in Figs. 5 and 6, at 20 and 62.4 GHz,
Table 3: Input parameter values extracted from selected
vegetation blocks at 20 GHz.
Tree 20 GHz
Label k
e
k
s
α β
T
1
0.38 0.28 0.36 10.7
◦
T
3
0.99 0.25 0.13 7.0
◦
T
11
0.75 NA 0.05 13.7
◦
T
12
0.68 NA NA 15.9
◦
T
17
0.45 NA 0.13 19.5
◦
Mean 0.65 0.26 0.17 13.4
◦
Table 4: Input parameter values extracted from selected
vegetation blocks at 62.4 GHz.
Tree 62.4 GHz
Label k
e
k
s
α β
T
1
0.31 0.13 0.08 4.7
◦
T
3
1.26 1.02 0.07 15.5
◦
T
11
0.81 NA NA 12.1
◦
T
12
0.51 0.10 0.15 14.9
◦
T
17
0.50 0.38 0.04 11.1
◦
Mean 0.68 0.41 0.09 11.7
◦
0 50 100 150 200 250 300 350
−70
−60
−50
−40
−30
−20
−10
0
RX antenna rotation angle (deg)
Excess attenuation (dB)
E
RMS
= 9.16 dB
Measured Signal
Predicted Signal
Figure 6: Measured and predicted signals in MP
2
at 62.4
GHz.
respectively. In these measurements, which were per-
formed at the air to vegetation interface, the RX sig-
nal level is strongly influenced by the direct path be-
tween the TX and the RX antennas. Hence, the plots
present a signal shape which is very close to the radi-
ation pattern of the receiver antennas, particularly in
the angular region around 0
◦
where the RX antenna
is pointing to the TX. Although a good overall agree-
ment between predicted and measured curves can be
observed, specially when the RX and TX antennas
are aligned, a slightly increased error is present in the
prediction of the signal which is scattered from the
forest. This may be explained due to some inaccu-
racy in the estimation of k
s
parameter corresponding
to the surrounding trees during the parameters extrac-
tion phase.
Figs. 7 and 8, present the results for M P
4
, which
is located behind tree number 1. The results for 20
GHz (Fig. 7) also present a good agreement between
the measured and the predicted received signal values.
Nevertheless, there is a tendency to underestimate the
scattered signal from tree number 1. This effect is
present in the 220 to 330
◦
angular range and might
be due to the incorrect estimation of the beamwidth
0 50 100 150 200 250 300 350
−80
−70
−60
−50
−40
−30
−20
−10
RX antenna rotation angle (deg)
Excess attenuation (dB))
E
RMS
= 8.91 dB
Measured Signal
Predicted Signal
Figure 7: Measured and predicted signals in M P
4
at 20
GHz.
0 50 100 150 200 250 300 350
−65
−60
−55
−50
−45
−40
−35
−30
−25
−20
−15
RX antenna rotation angle (deg)
Excess attenuation (dB)
E
RMS
= 7.58 dB
Measured Signal
Predicted Signal
Figure 8: Measured and predicted signals in MP
4
at 62.4
GHz.
of the scattering profile of tree number 1. The un-
derestimation of this parameter will concentrate the
scattered radiation in the forward scattering region
(θ
RX
= 340
◦
) leading to the mentioned inaccuracy.
Around θ
RX
= 200
◦
the dRET model predicts a peak
in the received signal which corresponds to the sig-
nal scattered from tree number 9. The misalignment
between this peak and the correspondent peak in the
measured signal is likely to be due to the approxima-
tion in discretisation of the tree position inherent to
the cell division process.
The 62.4 GHz plot (Fig. 8) presents an absolute er-
ror of 10 to 13 dB in the forward scattering region
(around 340
◦
). This can be due to some blockage
which was taken into account in the k
e
extraction. In
fact, k
e
is extracted by measuring the excess atten-
0 50 100 150 200 250 300 350
−80
−70
−60
−50
−40
−30
−20
RX antenna rotation angle (deg)
Excess attenuation (dB)
E
RMS
= 9.02 dB
Measured Signal
Predicted Signal
Figure 9: Measured and predicted signals in M P
9
at 20
GHz.
0 50 100 150 200 250 300 350
−70
−65
−60
−55
−50
−45
−40
−35
−30
−25
−20
RX antenna rotation angle (deg)
Excess attenuation (dB)
E
RMS
= 14.5 dB
Measured Signal
Predicted Signal
Figure 10: Measured and predicted signals in M P
9
at 62.4
GHz.
uation caused by the tree, using a radial path which
is different from the line used to measure the atten-
uation. Attenuation differences between different ra-
dial paths of 20 dB have been published in literature
(Caldeirinha, 2001). This may help to explain this
discrepancy.
Figure 9 presents the measured and predicted re-
ceived signal values in position MP
9
at 20 GHz.
A good correspondence between the two values
is present in the forward scattering region around
θ
RX
= 330
◦
± 70
◦
. In the angular region where the
RX antenna is pointing away from the test forest, i.e.
30
◦
≤ θ
RX
≤ 110
◦
the measured signal shows an in-
creased received signal level which appears to be due
to scattering in the vegetation structures surrounding
the test forest. These structures, lying outside the

Table 5: Model performance assessment using the RMS er-
ror criterion.
Measurement RMS error (dB)
Position 20 GHz 62.4 GHz
MP
1
11.8 9.0
MP
2
10.8 9.2
MP
3
13.9 7.8
MP
4
8.9 7.6
MP
5
12.5 16.5
MP
6
13.5 13.5
MP
7
9.6 6.7
MP
8
18.7 11.8
MP
9
9.0 14.5
MP
10
13.2 NA
Mean 12.2 10.7
test forest were not modeled and consequently are not
taken into account by the dRET modelling thus ex-
plaining why the model seems to be unable to predict
accurately the signal level within this angular region.
At 62.4 GHz the signal level in position M P
9
was
relatively low and could only be measured for a nar-
row angular region. Outside this region the received
signal was too close to the receiver noise level, which
is around -70 dBm, to be measured. The measured
and predicted values seem to exhibit a level offset
which seems to be due to a vertical misalignment of
the RX antenna. This offset generates a larger RMS
error when compered with the remaining measure-
ment positions.
The overall RMS error for the complete set of mea-
surement performed at 20 and 62.4 GHz is shown in
Table 5. The RMS error is consistently below 15 dB
except at a few locations in the forest. The mean over-
all RMS error is 12.2 and 10.7 dB at 20 and 62.4
GHz, respectively. Although the RMS error values
are slightly above figures found in other published re-
sults, these can be considered reasonably low. They
also demonstrate the benefits of dRET modelling, par-
ticularly when considering inhomogeneous media.
5 CONCLUSIONS
This paper presents a model for radiowave propaga-
tion in inhomogeneous vegetation media for micro
and millimeter waves, which is based on the RET. The
model relies on 4 vegetation dependent propagation
parameters and a method to extract and scale these
parameters is also presented. The input parameters
are extracted from the different vegetation volumes
forming the test forest using the proposed method at
20 and 62.4 GHz. Subsequently these parameters are
used in the model to generate excess attenuation pre-
dictions at several locations inside the test forest. Fi-
nally, the predicted and measured results are com-
pared using the RMS error criterion. This is shown
to be consistently below 15 dB. Although this RMS
error value is within the range of other published re-
sults, in some measurement locations the error was
found to be as high as 18.7 dB. This is thought to
be due to localised blockages, inaccuracies in the pa-
rameter extraction method and also misalignment of
the RX antenna during the attenuation measurement
phase. An improved parameter extraction method is
thus being investigated to eliminate higher error dis-
crepancies.
REFERENCES
Caldeirinha, R. F. S. (2001). Radio characterisation of sin-
gle trees at micro- and millimetre wave frequencies.
PhD thesis, University of Glamorgan.
Didascalou, D., Younis, M., and Wiesbeck, W. (2000).
Millimeter-wave scattering and penetration in isolated
vegetation structures. IEEE Transasctions on Geo-
science and Remote Sensing, 38:2106–2113.
Fernandes, T., Caldeirinha, R., Al-Nuaimi, M., and Richter,
J. (2005). A discrete RET model for millimeter-wave
propagation in isolated tree formations. IEICE Trans-
actions on Communications, E88-B(6):2411–2418.
Fernandes, T., Caldeirinha, R., Al-Nuaimi, M., and Richter,
J. (2006). A practical method for vegetation scat-
tering function parameter extraction and scaling. In
Loughborough Antennas and Propagation Conference
- LAPC, volume 1, pages 105–109, UK.
Ishimaru, A. (1997). Wave propagation and scattering in
random media. IEEE Press.
ITU-R (2005). Recommendation ITU-R P.833-5, Attenua-
tion in vegetation. ITU-R.
Johnson, R. A. and Schwering, F. (1985). A transport the-
ory of millimeter wave propagation in woods and for-
est. Technical Report CECOM-TR-85-1, Forth Mon-
mouth.
Richter, J., Caldeirinha, R., and Al-Nuaimi, M. (2002).
Phase function measurement for modelling radiowave
attenuation and scatter in vegetation based on the the-
ory of radiative energy transfer. Proceeding of PIMRC
2002, pages 146–150.
Rogers, N. C., Seville, A., Richter, J., Ndzi, D., Caldeirinha,
R., Shukla, A., Al-Nuaimi, M., Craig, K., and Austin,
J. (2002). A generic model of 1-60GHz radio propaga-
tion trough vegetation - Final report. Technical report,
Radiocommunications Agency.
