
A Fusion Methodology for Recognition of Off-Line
Signatures
Muhammad Arif
1
, Thierry Brouard
1
, Nicole Vincent
2
1
Laboratoire d’Informatique, Université de Tours
64, avenue de Jean Portalis, 37200 Tours, France
2
Laboratoire CRIP 5 – SIP
Université René Descartes
45, rue des Saints Pères,
75270 Paris Cedex 06 France
Abstract. In this paper we are presenting a work concerning the classification
and recognition of off-line signatures. Signatures form a special class of hand-
writing in which legible letters or words may be impossible to exhibit but we
can extract some features with the help of some parameters. Our proposed fu-
sion methodology for improving the classification and recognition performance
of classifiers is based on Dempster-Shafer evidence theory in which our contri-
bution regarding to solve the problems like selection of focal elements and
modeling the belief functions is also given. Distance classifiers studied, clas-
sify off-line signature images with the help of signature images projection
along different axes and by employing some geometrical and fractal parameters
which are explained in this article. Dempster-Shafer theory when applied for
the fusion of these classifiers has improved the overall recognition rate.
1 Introduction
People have different handwriting styles characterized by more or less distinguishable
features. Signatures form a special class of handwriting in which legible letters or
words may be impossible to exhibit. Nevertheless they provide secure means for
authentication, attestation and authorization in legal, banking or other high security
environments and they are recognized as legal evidence. The achievement of an
automatic signature recognition and verification system has a lot of problems to
solve, which have been reported by many researchers from the very early stages of
work in this field. A signature system can be classified as either on-line or off-line
based on the hardware front-end. On-line system [1] employs an electronic pen and
pad which provides dynamic. In off-line system, signatures written on paper are con-
verted to electronic form with the help of scanner or camera. Here we are concerned
with off-line system. The main difficulty can be expressed in form of interpersonal
and intrapersonal variations. A lot of useful features have been used to differentiate
the signatures of one person from others. Still a work on efficient feature extraction
Arif M., Brouard T. and Vincent N. (2004).
A Fusion Methodology for Recognition of Off-Line Signatures.
In Proceedings of the 4th International Workshop on Pattern Recognition in Information Systems, pages 35-44
DOI: 10.5220/0002682200350044
Copyright
c
SciTePress

system is needed in this area. The features proposed in off-line system can be charac-
terized as global, geometric, structural or statistical. Use of transform-based represen-
tations and critical points from off-line drawing of signatures has been reported in [2]
and [3] respectively. In [4] combination of global geometric and grid features has
been presented. A connectionist scheme of combining classifiers based on moment
measures and envelope characteristics has been reported in [5]. Four types of pattern
representations via geometric features, moment based representations, envelope char-
acteristics and tree-structured wavelet features have been employed in [6]. In [7] a
combination of static image pixel features and pseudo-dynamic structural features
have been employed.
In this paper, we are focusing on two points. On the one hand we present easy fea-
tures and some more relevant in a biometry system. On the other hand we have cho-
sen to split the use of each type of features to highlight the information they are able
to bring in the problem solving and then achieve the fusion of different information.
This is quite a different methodology from feature selection approaches. We have
taken into account very different features. Classification based on these factors and
realized with the help of distance classifiers was first achieved. Then recognition by
combining these classifiers is proposed. Other methodologies rest on the basis of
neural networks or HMM. Here we are proposing Dempster-Shafer evidence theory
as a combining tool. This theory has been reported with remarkable performance
when applied in different fields in order to achieve fusion. Without being exhaustive,
we can mention a certain number of application areas exploiting the advantages of
this theory, such as multi-sensors fusion, classifiers combination, pattern recognition,
environment monitoring, image processing [8], [9], [10], [11], [12], [13], [14] etc. It
proves that use of Dempster-Shafer theory is very productive, but its efficiency
depends considerably on the function which is employed as function of allocation of
mass of belief. Indeed, this function represents a model for uncertainty and
imprecision of information. In the majority of the cases, modeling of the belief
function used, is empiricaly fixed by the expert. First, we will precise the features we
have chosen and then their performances will be evaluated. After some recalls on
Dempster-Shafer evidence theory the merging process we propose will be explained
and the results analyzed.
2 Preprocessing and feature extraction
Besides the variability that occurs due to the author of the signature himself, all
image-processing applications suffer from noise due to the acquisition process, such
as touching line segments, isolated pixels and smeared images. Nevertheless we as-
sume that the signatures have already been extracted from the background. For signa-
ture discrimination various aspects can be considered and different features will be
extracted from signature images. These different features help to establish several
classifiers. We have chosen on the one hand, global simple features as the histograms
that omit some spatial information, and on the other hand some geometrical parame-
ters including some fractal parameters either global or local.
36
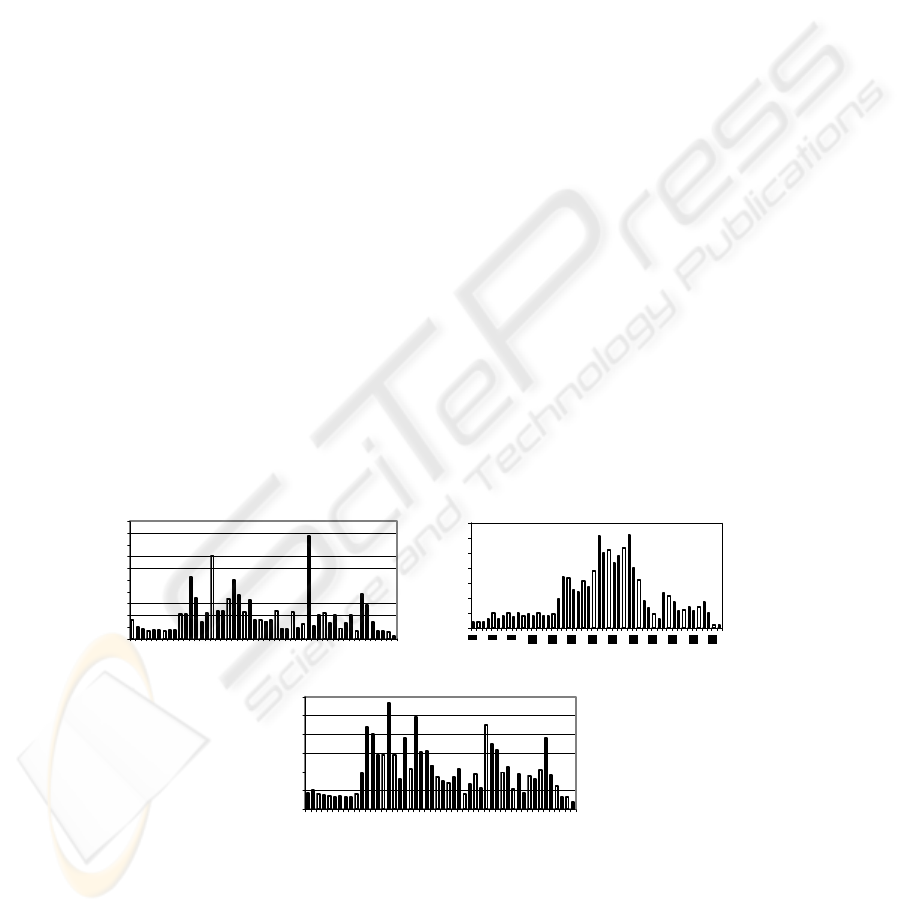
2.1 Histograms
Obviously, a person cannot draw his own signatures twice, 100% identical. In fact,
there are always some local alterations in different signatures of a person while the
signatures global shape remains the same. We can do an approximate analysis for
signatures identification by employing some histograms of the number of projection
pixels on various axes. These axes may be linked to the image as horizontal and ver-
tical x-axes and y-axes respectively or may be linked to the signature itself following
the direction of the signatures.
Signatures projection on Cartesian axes gives horizontal and vertical histograms,
simpler to draw. These histograms allow studying the variations in number of pixels
along the horizontal or vertical axe. Projection on horizontal axe of a signature image
enables us to see whether the signature points are distributed rather on the left or the
right-hand side of the signature. Projection on vertical axe gives an indication on the
distribution in height of the signature points. Once the histogram is normalized as
frequencies, it makes the study invariant toward either image resolution, or the size of
the original signature. The precision of the study depends on the number of classes
defined in the histogram. It will be the same for each signature. It is now easy to com-
pare them.
The histogram along the axis of siganture’s own slope follows the same principle
in general. In this case, first the direction of the signature based on its slope (principal
axis of the signature) has to be extracted. This axe can be deduced from the eigen
values and vectors of the signature image. With an ellipse similar to the inertial
ellipse, covering 90 % of the signature, it would be possible to eliminate certain
unnecessary features (for example an underline whose length is not stable on several
signatures). The histogram obtained on this new axe is often close to the traditional
horizontal and vertical histograms but look more stable. The distance chosen between
two histograms is a traditional distance, a quadratic distance. It reflects the variations
existing between two signatures.
0
1
2
3
4
5
6
7
8
9
10
1
4
7
10
13
16
19
22
25
28
31
34
37
40
43
46
49
(a) Horizontal histogram
0
1
2
3
4
5
6
7
(b) Vertical histogram
0
1
2
3
4
5
6
1
4
7
10
13
16
19
22
25
28
31
34
37
40
43
46
49
(c) Histogram along principal axis
Figure 1 : Normalised histograms of a same image along different axes.
37

2.2 Geometric and fractal parameters
A signature being a completely personal graphic has some particular discriminating
characteristics. In this part we will present various parameters being able to extract
these caracteristics from the signatures images. These are different from those studied
with the help of histograms because they represent the complexity and shape of
signatures. We will be interested first of all in signature image contours. There are
several types of image contours and we will see how they can lead to a signature
characteristic. Then we will study the fractal parameters which give an index of
signature complexity. Then we will make use of the local fractal dimension to detect
the irregular zones in the signature and thus to compare them. Then we will see a
mass dimension which gives an index on the shape of image and which appears to be
complementary to fractal dimension. The last parameter that we are studying is the
direction of the signature which appears rather stable for a person. Finally, we will
see how to use these parameters in the framework of signature recognition.
2.2.1 Extraction of image contours
Contours or envelopes of signature have already been used for signature recognition.
We will be interested particularly in their proportion compared to whole signature.
Thus we will be able to compare the "perimeter" of the signature and its "surface".
Indeed two objects having same area may not possess the same perimeter (or vice
versa) and it is interesting to see in which measurements they are proportional. In
literature there exists several types of contours. For each type of contours used, we
will calculate the ratio of “Number of pixels in contour / total number of pixels in the
image.”
First we are studying classical contours extracted from a binary image using 4
connexity notion. Second type of contours studied, is the exterior contour. In fact it
corresponds to a part of classical contours. We select only the first black pixels on
each row and column from the image edge.
2.2.2 Fractal dimension
A fractal dimension is a real number that is used to measure the degree of irregularity
and fragmentation of a set [15]. From our point of view, it gives an index qualifying
the shape of a signature. Several methods of computing fractal dimension exist
approximating the exact formula.
The fractal notion makes it possible to determine the length of a complex curve X.
It is realised by the use of fractal dimension. To compute it, we consider the set of X
minimum mappings by η radius balls. These mappings are figured by successive
dilations of X : X
η
, and let A(X
η
) be its area. The fractal behavior of the X set is ex-
pressed by the linearity of the relation that links lnA(X
η
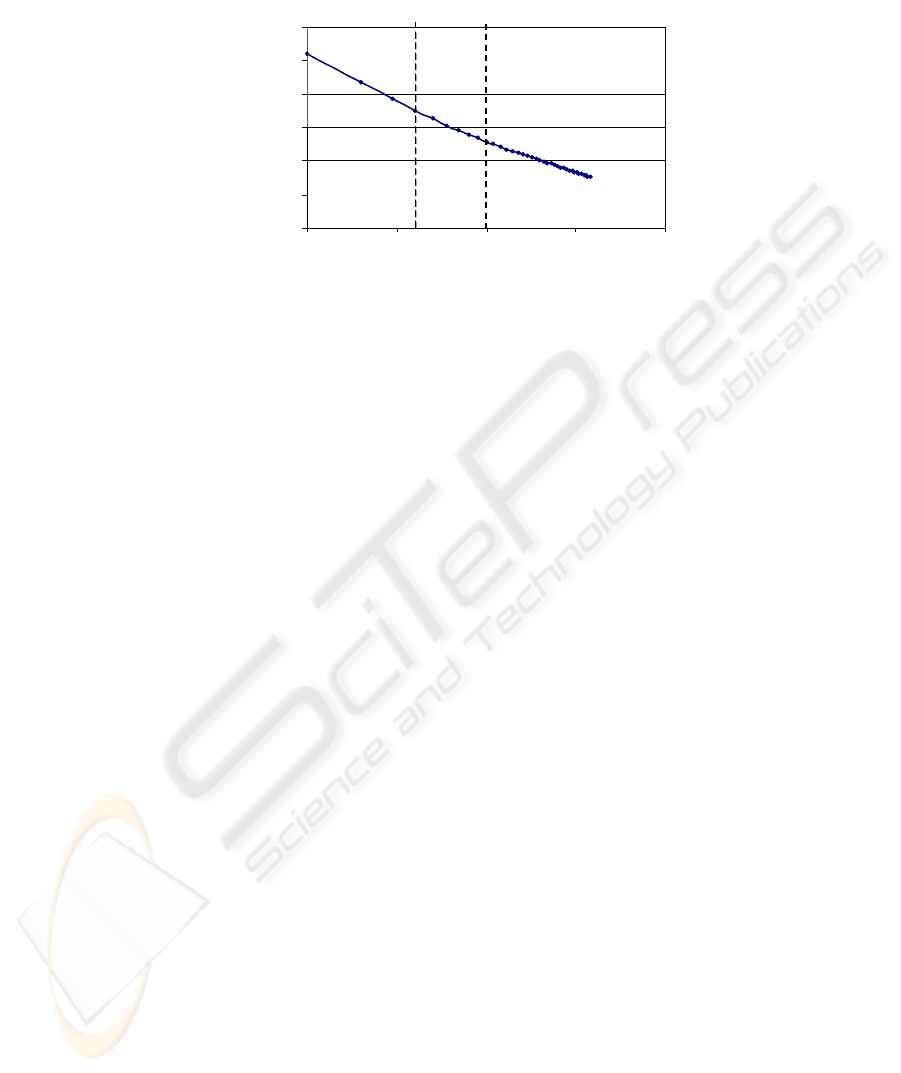
) and ln η. In [16] a graph
called an evolution graph (as shown in the figure) enables to study the relation linking
ln η and lnA(X
η
)/ ln η. The fractal dimension is then computed from the formula:
D(X) = 1-p, in which p is the slope of the straight line approximating the plotting.
38
ln A(X
η
)/ ln
η
3
3,2
3,4
3,6
3,8
4
4,2
00,5 11,5 2
Zone 0 Zone 1 Zone 2
ln
η
(η
is index of dilation
)
Figure 2 : Evolution graph obtained with 40 dilations from a signature image
In the evolution graph three zones are extracted, each one corresponding to a set of
dilations in signature image. First zone (Zone 0) corresponds to first 3 or 4 dilations
of the image and thus filling of the signature image contour. The number of dilations
necessary for this zone depends on the resolution and width of the signature sketch.
Second zone (Zone 1) called as fractal dimension FD1, corresponds to dilations
according to the filling of image contours. It is consequently more interesting to
study. Indeed it corresponds to a study of the signature image seen at a distance of
"normal" reading. It is this zone which will enable us to determine fractal dimension
because it gives general feeling from the signature. It thus gives us an index on the
"legibility" of the signature. Third zone (Zone 2) called as fractal dimension FD2,
has a slope slightly different from that of the zone1. It corresponds to dilations at
higher level when the signature image starts "to be filled". Consequently, it figures
observation of the signature at an enough large distance from where one cannot any
more distinguish the details of the signature but its very general shape. This zone is
used to define secondary fractal dimension. It indicates us if the signature is
"readable" at a longer distance. To this parameter, we prefer the use of a third
parameter called as implication index (∆ = FD1 – FD2), it characterises the evolution
of the legibility of the signature when the distance from the viewpoint increases.
2.2.3 Extraction of rigurous zones in signature image
Whereas fractal dimension gives a global indication on the signature, here, we are
looking for local zones more complex in the design that others. Then on the grey
level image we are caluculating local fractal dimension of each pixel with respect to
its neighborhood. It provides us with rigurous zones in signature image. Defining a
threshold value for local fractal dimesion allows to reveal a strong local irregularity.
A regular zone has a fractal dimension of value 2 whereas a very rough surface can
have a fractal dimension approaching to value 3.
39

2.2.4 Mass dimension
This parameter makes it possible to measure the distribution of the pixels defining the
signature image. Its calculation method is relatively simple. It is necessary first of all
to select a certain number of points randomly in the signature image, let say 10%.
This parameter is then calculated by studying each selected point. For that, the nature
of neighboring pixels of the point selected is observed. Thus the number of black
pixels (pertaining to the feature of the signature) are counted in the neighboring
matrix of 3, 5 and 7 etc. A linear relation between ln(neighboring pixels) vs
ln(number of black pixels) is studied. The first coefficient of this relation indicates
the mass dimension. Its average value for the 10% points selected in the signature
image gives an overall mass dimension value for the signature image under studying
and which can be used as a comparison tool with other signature images.
2.2.5 Signature’s slope
Generally, people draw their signatures with same angle. One can visually notice it in
the majority of the signatures. We thus thought of using this angle as parameter
because it appears to be stable. It is calculated from the principal inertia axis.
3 Classifiers and evaluation of their performanace
From these sets of parameters we have studied 4 classifiers based on horizontal histo-
gram, vertical histogram, histogram based on signature’s principal axe, and one clas-
sifier representing 7 geometrical and fractal parameters as discussed in previous sec-
tion.
For the evaluation of classifiers performance, we are employing “leave-one-out
method”. Say that N samples are available for estimating the error rate for a classifi-
cation system. The leave-one-out method can be applied here by using N-1 samples to
train the classifier and the remaining sample to test the classifier. The result is then
recorded and this procedure is repeated N times, each time a different test sample is
excluded. The error rate is then estimated using the average of these N trials.
4 Dempster-Shafer evidence theory
In order to combine information coming from different sources, Shafer [17] has cre-
ated the evidence theory on the bases formulated by Dempster. The theory can com-
bine evidence in a consistent manner to come at a more complete assessment of what
the entire body of evidence implies. The most important factor is the modeling of
belief functions. Once the belief functions are obtained, fusion is carried out by
Dempster information combination rule. In this theory, let Ω = { H
1
, H
2
, H
3
, …., H
M
}
be the set of possible propositions, called the frame of discernment. Let 2
Ω
denotes
the set of the 2
M
propositions H of Ω : 2
Ω
= {H / H
⊆
Ω} = {φ, {H
1
}, …, {H
M
},
40

{H
1,
H
2
}, …., Ω}. Information bringing an opinion on the state of a system is charac-
terized by a function or a degree of belief m. This function m is defined by m: 2
Ω
→
[0,1], and has the properties that m(
φ
) = 0 and = 1. The quantity
m(H) is called basic probability number of H. It measures the belief that is committed
exactly to H. The subsets of 2
∑
Ω⊆H
)H(m
Ω
whose mass is non null, are called focal elements. A
situation of total ignorance is given by m(Ω) = 1 and of total certainty (on a singleton
assumption) by m(H
n
) = 1 where H
n
represents a singleton proposition. To obtain the
measure of the total belief committed to H, one must add to m(H) the quantity m(H’)
for all subsets H’ of H such that Bel(
φ
) = 0, and
∀
H ⊆ Ω Bel(H) =
∑
⊂HH'
m(H’).
There is one-to-one correspondence between the belief function and the basic prob-
ability assignment. The main difficulty consists in modeling knowledge to initialize
the basic belief assignment m(.). Many modeling methods have been proposed, which
depend usually on the considered application.
Now, if we have several sources of information S
j
(j = 1, …., J) providing their
functions m
j
, then a single belief function can be obtained by combining them (m =
⊕
J
j =1
m
j
) according to Dempster’s orthogonal operator :
∀ H Ω, H
≠
φ
, m(H) = ⊆
K−1
1
⎟
⎟
⎠
⎞
⎜
⎜
⎝
⎛
∏
∑
=
=∩∩
J
j
H(j
HH...H
)m j
j
1
1
(1)
where
K = (2)
⎟
⎟
⎠
⎞
⎜
⎜
⎝
⎛
∏
∑
=
=∩∩
J
j
H(j
H...H
)m j
j
1
1
φ
The normalization coefficient
K represents the conflict between two sources. It has
value between 0 and 1. If
K is equal to 0, the sources are in perfect agreement but if K
is equal to 1, they are in total conflict. In this last case, fusion cannot be achieved by
Dempster-Shafer theory. A conflict mass
K is generated when the information sources
are neither independent nor perfectly reliable and modeling of belief functions is too
vague. In order to cope with this problem, other combination operators have been
proposed in the literature [18].
Modeling of belief functions lacks of generality. However, two types of ap-
proaches can be mentioned : (i) based on distance calculation, (ii) based on similarity
measure. According to the nature of our classifiers we are more interested in the first
approach but our work differs from other propositions [19]. We now present our
contribution to modeling of belief functions in an automatic way [20]. Indeed, we are
dealing with pattern recognition. An incoming pattern X has to be classified in class
C
i
by combining two or several distance classifiers. Distance classifiers give the re-
sults by rank level outputs in form of the classes C
i
(i = 1 to M) of prototypes X
i
( i =
1 to N) according to their distance d(X, X
i
). We define a proposition H in the frame
of discernment
Ω as X∈C
i
or simply C
i
so: Ω = {C
1
, ..., C
M
} Now focal elements and
their belief functions are defined.
Focal elements are the sets of n classes that are concerned by the first neighbors (n
varying from 1 to k). Before combining results each classifier is considered on its
own. For the purpose of modeling belief function associated with each incoming
41

element, we are introducing a fuzzy membership function to X
i
prototype classes. The
prototypes are those in the neighborhood of incoming X, it is noted by F
Xi
(X). A
fuzzy membership function for a class noted by F
C
(X) is calculated by taking an aver-
age value of its prototypes membership values. The function has values between 0
and 1, and has to give a maximum value towards 1 when X belongs to the class. The
main variables we have taken into account for a given classifier are (1) Choice of k
nearest neighbors of incoming pattern X and the distances associated with. (2) Rank
R
X
(X
i
) of the output classes of prototypes, ordered according to the distance d(X, X
i
).
(3) N
X
(C) which is a class repetition number among the k nearest neighbors consid-
ered. (4) V
Xi
(X), the ratio between the distances d(X, X
i
) and d(X, Xz) where Xz
represents the preceding prototype in the rank level output of the classifier. Here is
our prototype based formalism:
∑
=
z
z
i
X
X
X
Xi
Xf
Xf
XF
)(
)(
)(
(3)
where
[
∑∑
+
+
+
=
z
zX
i
z
z
i
iX
X
X
X
))X(R(/
)X(R/
)X,X(d/
)X,X(d/
)X(f
41
1
41
1
]
∑∑
+
+
+
+
z
z
i
z X
X
X
X
X
X
))X(V(/
)X(V/
))C(N(.
))C(N(
41
1
41
2
(4)
Each term has to be maximum when X and prototypes considered belong to the
same class. The weights are chosen in order to balance the different influences. This
function is then employed for modeling the belief function.
m
i
({A
1
}) = F
X
σ
(1)
(X), ..., m
i
({A
1
, A
2
, …., A
g
}) = F
X
σ
(g)
(X) (5)
where X
σ
(j)
(j = 1, .., g) represents the prototypes appearing in k nearest neighbor-
ing prototypes. m(
Ω) complements the evidence to 1. the results using this modeling
approach and its performance are shown in the following section.
5. Experimental results
Our database consists of 540 scanned images of handwritten off-line signatures ob-
tained from 36 persons who were asked to sign for 15 times each. Four trained dis-
tance classifiers (e
1
, e
2
, e
3
, e
4
) with Euclidean distance classified these signature im-
ages after their feature extraction. First three classifiers are those constructed from
42

horizontal, vertical and signature’s own direction based histograms and the 4th classi-
fier is based on a set of primitives as fractal dimension, mass dimension, signature’s
slope and signature’s image contour fraction etc. Performance of these classifiers was
calculated with
leave-one-out method. The recognition rates obtained for four classi-
fiers employed, are shown in the table 1 with 5-NN and 10-NN. Here, the decision
that incoming prototype X
∈ C
i
was taken by the classifier with k-nearest neighbor
rule taking into account the classes of first 5 or 10 nearest neighboring prototypes of
X.
The recognition rates of classifiers were improved by combining them with the
help of Dempster-Shafer evidence theory based on our fuzzy modeling approach of
belief functions. The results obtained are shown in the Table 1. Fusion by employing
DS theory with our belief function modeling was achieved by taking first 5 or 10 rank
level outputs of classifiers. The decision rule was the proposition with the maximum
belief value. We can note from the table 1 that Dempster-Shafer evidence theory can
deal with several classifiers even if some are of poor quality. This is not the case with
a general vote majority method whose result is also shown in the table 1.
Classifier / method
e
1
e
2
e
3
e
4
A vote
majority
method
Evidence
theory
5-NN 68,69 53,98 71,81 69,33 Recognition
rate (%)
10-NN 61,97 50,08 67,79 65,75
82,30
94,10
Table 1 : Performance of different classifiers and our fusion methodilogy.
6. Conclusions and perspectives
A work concerning the recognition of off line signature has been presented. Some
easy features based on histograms and some particular biometric features based on
geometric and fractal behaviour were used for classification of different signatures.
The classification information of these rather poor classifiers were then combined by
use of Dempster-Shafer evidence theory with our belief function modeling approach.
The results obtained with real signatures images has shown very tremendous
improvement of the individual classifier’s performance.
In our next works, we intend to compare our results with those obtained by feature
selection among 157 features that are involved in the four classifiers employed. We
also will quantify the improvement brought by each classifier and introduce new
features.
43

References
1. R. Plamondon and S.N. Srihari, On-line and off-line handwriting recognition: a comprehen-
sive survey. IEEE Trans. Pattern Anal. Mac. Intell. 14 1 (2000), pp. 3–19.
2. R. Sabourin, G. Genest and F. Preteux , Offline signature verification by local granulometric
size distributions. IEEE Trans. PAMI
19 8 (1997), pp. 976–988.
3. S. lee, J. C. Pan, Off-line tracing and representation of signatures, IEEE Trans. Systems Man
Cybernetics. SMC-22 (1992) 755-771.
4. Y. Qi, B.R. Hunt, Signature verification using global and grid features, Pattern Recognition,
27(12), 1994, 1621-1629.
5. R. Bajaj, S. Chaudhury, Signature verification using multiple neural classifiers, Pattern
Recognition 30(1) (1997) 1-7.
6. V. E. Ramesh, M.N. Murty, Off-line signature verification using genetically optimized
weighted features, Pattern Recognition, 32 (1999), 217-233.
7. K. Huang, H. Yan, Off-line signature verification using structural feature correspondence,
Pattern Recognition, 35(11), (2002) 2467-2477.
8. H. Kim and P. H. Swain, Evidential reasoning approach to multisource data classification in
remote sensing, IEEE Trans. on Sys., Man and Cybernetics, 25(8): pp. 1257-1265, 1995.
9. L Xu, A Krzyżak, C. Y Suen, Methods of Combining Multiple Classifiers and Their Appli-
cations to Handwriting Recognition, IEEE Transactions on Systems, Man and Cybernetics,
22(3) 1992, 418-435.
10. E. Mandler and J. Schurman, Combining the classification results of independent classifiers
based on Dempster-Shafer theory of evidence, International Journal of Pattern Recognition
and Artificial intelligence, pp. 381-393, 1988.
11. G. Ng and H. Sing, Data Equalization with Evidence Combination for Pattern Recognition.
Pattern Recognition Letters, 19 (1998) 227-235.
12.W. B. Luo and B. Caselton, Using Dempster-Shafer theory to represent climate change,
Journal of Environment Management, 49: 73-93, 1997.
13. I. Bloch, Some Aspects of Demspter-Shafer Evidence Theory for Classification of Multi-
Modality Medical Images Taking Partial Volume Effect into Account, Pattern Recognition
Letters 17, 1996, 905-919.
14. A. Verikas, K. Malmqvist, and M. Bacauskiene, Combining Neural Networks, Fuzzy Sets,
and Evidence Theory Based Approaches for Analyzing Colour Imges, IEEE-INNS-ENNS
International Joint Conference on Neural Networks, Como, Italy, July 2000 pp 297-302.
15. B. Mandelbrot. Fractals: Form, Chance and Dimensions, Freeman, San Francisco, CA,
1977.
16. V. Bouletreau, N. Vincent, R. Sabourin, and H. Emptoz. Synthetic parameters for handwrit-
ing classification, IEEE 1997, 102-106.
17. G. Shafer, A mathematical Theory of Evidence, Princeton Univ. Press, Princeton New
Jersey, 1976.
18. R. R. Yager. On the Dempster-Shafer Framework and New Combination Rules. Info. Sc.,
41, 1987, pp. 93-138.
19. T. Denoeux, A k-Nearest Neighbor Classification Rule Based on Dempster-Shafer Theory,
IEEE Transactions on Systems, Man, and Cybernetics, 25(5), 1995, 804-813.
20. M. Arif, T. Brouard, and N. Vincent, Non parametric fuzy modeling of belief function in
evidence theory, 15
th
Conf of IASTED, MS2004, March 1-3, Marina Del Rey CA, USA
44
