
Design Measures for Distributed Information Systems:
an Empirical Evaluation
Pablo Rossi and George Fernandez
School of Computer Science and Information Technology,
RMIT University, Melbourne, Australia
Abstract. Due to the different nature of the available dynamic interactions
between components afforded by some middleware infrastructure, distributed
information systems (DIS) behave differently from traditional centralized ones.
This results in a different view of their quality attributes, which require
specifically customized measures for accurate estimation. In previous work we
proposed and theoretically validated design measures purposely defined for
DIS. In this paper we investigate the relevance of the newly proposed measures
to estimate one of the quality attributes of interest for DIS. To this end, we have
applied the proposed measures to a proof-of-concept DIS in the context of an
Australian university, for the ultimate purpose of efficiency estimation. The
research concludes that most of the proposed measures are indeed correlated to
the efficiency and are suitable to be used as part of estimation models.
1. Introduction
Precise quality indicators are an essential element for the success of information
system projects. An information system of poor quality may have a significant
influence on an enterprise operation and reputation. It is widely accepted that the
design will have a deep impact on quality of the software as an operational entity [1].
Regrettably, there is not a single, unique way of measuring quality of software
artefacts since, due to the frequent changes in technologies, methods and tools,
software production is a continuously evolving process.
New distributed technologies, such as Message Oriented Middleware, Web
Services, CORBA, J2EE and .NET, have been established in the enterprise world in
recent years. With the rising importance of information systems in general enterprise
matters, the early evaluation and estimation of quality attributes of systems developed
with these technologies is becoming a crucial area for research. Significant
differences can be identified when comparing modern distributed information systems
with traditional centralized ones, such as the possibility of partial failures, hardware
and software heterogeneity, concurrency of components and, very importantly, new
forms of interactions between components [2]. Because of these differences, it is
necessary to revise, adapt and extend commonly used methods and tools to be able to
apply them to the domain of DIS.
Rossi P. and Fernandez G. (2004).
Design Measures for Distributed Information Systems: an Empirical Evaluation.
In Proceedings of the 1st International Workshop on Software Audits and Metrics, pages 95-104
DOI: 10.5220/0002678900950104
Copyright
c
SciTePress

Given the importance of appropriate measures for accurate estimation of quality
attributes, the literature provides many examples of software measures for traditional
centralized information systems. However, only a few measures have been
specifically developed for distributed scenario (e.g. [3], [4], [5]). The majority of
these are not used in practice or in academia because either they have not been
defined rigorously or they have not been empirically validated. As far as we know,
there has been only one previous study [6] undertaking the empirical validation of
software measures in the distributed arena, but it does not address design measures.
Our research project focuses on the measurement of attributes of DIS design
artefacts. An ultimate goal of this investigation is to evaluate empirically the proposed
measures for the estimation of DIS quality attributes of interest such as efficiency,
reliability and maintainability. Particularly, the following objectives drive this paper:
• To find out which of the design measures defined and theoretically validated in
our previous work [7] have, statistically and practically, a significant
relationship with the efficiency of an operating DIS.
• To investigate to what extent those measures can be used, separately or in
combination, for estimating efficiency.
These issues are being investigated using data collected from a DIS in a controlled
experiment performed in one of our research laboratories.
The rest of this paper is organized as follows: Section 2 contains a brief discussion
of the background required to make the paper self-contained. Section 3 presents a
detailed description of our study. The results of the study are reported in Section 4.
Finally, Section 5 presents a summary, as well as future research directions.
2. Background
Distributed computing is a term often used in the literature with different
meanings. Hence, it is important to understand this concept as used in our research.
Typically, a distributed execution environment is comprised of multiple processes that
can communicate with one another by an interconnecting network. In our context, the
network is used to support the execution of autonomous components that cooperate –
at the application level– with one another, working towards a common goal supported
by some middleware infrastructure. Hence, distributed computing, in our case, may be
also appropriately called cooperative computing [8].
At the application level, cooperation between the distributed components of a
system can take several forms, depending on the requirements of the interaction [9]. A
processing dependency means that the components are linked by a request/reply
interaction. An informational dependency is found when the interaction between the
two components is limited to exchanging information.
In centralized information systems, there is essentially one way for two software
components to interact: a procedure or method call. Consequently, each interaction
may be deemed to have the same influence over quality attributes. However, due to
the different ways in which distributed components interactions may be resolved,
dynamic – that is, run-time – aspects of inter-component communication ought to
have a different impact on DIS quality attributes such as efficiency, reliability and
96

maintainability [10]. The possible different modes of communication between two
running components have been discussed previously [9] and are listed here:
• Synchronous vs. asynchronous
• Available vs. non-available
• Conversational vs. non-conversational
• Static vs. dynamic binding
Frequently, enterprise information systems are distributed because they tend to
reflect the structure of organizations, and the way in which organizational units
interact with each other. In these cases, the components of a system that have been
developed independently and operate autonomously are made to exchange
information and/or processing. We consider the components of such a DIS as the
fundamental units to be studied. However, when components are naturally grouped
together – because they are part of the same subsystem, or because they execute on
the same hardware platform, for example – we will also consider clusters of such
components. Even though we are particularly interested in these systems, the
generality of our approach makes it suitable to a broader range of DIS.
3. The Empirical Study
We have followed some of the guidelines provided by Wohlin et al [11] and
Kitchenham et al [12] on how to perform and report controlled experiments. (Please
note that not all available information has been included due to space constraints.)
3.1. Definition
Following the GQM template [13], the experiment goal is defined as follows:
Analyse distributed coupling measures,
for the purpose of evaluating,
with respect to their capability of being used as indicators of efficiency,
from the point of view of DIS software engineers,
in the context of a proof-of concept DIS developed by a team of CS graduates.
3.2. Planning
Context. The DIS studied is a proof-of-concept Academic Management System for
an Australian university. The system, developed by a team of Computer Science
graduates, it is entirely written in Java and it is composed of 21 executable distributed
components, 67 classes and about 11,000 lines of code. The middleware used by
components to interact are JDBC, JRMI and JMS [14].
97

Experiment Design. In order to evaluate software measurement hypothesis
empirically, it is possible to adopt two main strategies [15]: (a) small-scale controlled
experiments, and/or (b) real-scale industrial case studies. In this case we chose the
first alternative, since it is more suitable to study the phenomena of interest in
isolation, without having to deal with other sources of variation, such as co-existing
systems, security mechanisms, etc. However, we envisage that after several
experiments the suite of measures will be shown to be robust, and we intend to test
the measures following the second strategy.
Hypotheses. We are particularly interested in design measures since it is widely
acknowledged that attributes of the intermediate software artefacts influence attributes
of the final software product [1]. Due to the different interaction modes of DIS
components discussed above, distributed coupling (i.e. the strength of component
interconnection) is one the key design attributes to be studied. Design artefacts that
capture the structure and behaviour of a DIS are the entities of interest — for more
details about how the structure and the behaviour of a DIS are represented by (graph-
based) generic abstractions, the reader is referred to our previous work [7]. Efficiency
is one of the quality attributes that we argue is affected by coupling in the case of DIS
[16]. In this paper we have chosen to focus on the following empirical hypotheses:
• The stronger the outbound structural coupling of a cluster of distributed
components due to dependencies, the more inefficient the cluster becomes.
• The stronger the outbound behavioural coupling of a distributed component in
terms of interactions, the more inefficient the component becomes.
These empirical hypotheses are refined into statistical hypothesis by instantiating
the independent variables with design measures and the dependent variables with the
quality measures [17].
Table 1. Structural and behavioural design measures
Measure Definition
NCoOPD Number of components of a cluster coupled by outgoing processing
dependencies to other clusters.
NCoOID Number of components of a cluster coupled by outgoing informational
dependencies to other clusters.
NClOPD Number of other clusters to which a cluster is coupled by outgoing
processing dependencies.
NClOID Number of other clusters to which of a cluster is coupled by outgoing
informational dependencies.
SyIL Length of nested outgoing synchronous interactions of a component.
AvIL Length of nested outgoing available interactions of a component.
StIL Length of nested outgoing statically bound interactions of a component.
NoSyI Number of direct outgoing synchronous interactions of a component.
NoAvI Number of direct outgoing available interactions of a component.
NoStI Number of direct outgoing statically bound interactions of a component.
98

Variables. The independent variables are measured by the four structural measures
and six behavioural measures shown in Table 1. Efficiency is a high-level quality
attribute, which it may be evaluated by targeting one of its sub-attributes: time
behaviour or resource utilization [18]. In our investigation, we are interested in time
behaviour as the dependent variable, which is measured by the total blocking time
(TBT) caused by remote communication.
Instrumentation. A tool was developed to extract generic high-level design
information about the structure and behaviour of the system. This information was
consequently used to compute the measures presented above (and eventually others
that might be defined). Monitoring code was added to the system in appropriate
locations to obtain the time measurement data.
3.3. Operation
Preparation. In addition to the monitoring and measurement code, special software
components were written to simulate the random operation of the system by end-
users. Before the actual experiment, several pilot experiments were run to make sure
that there were no apparent anomalies, and the system behaved in the same way as
before the measurement and simulation code was introduced.
Execution. The experiment was conducted in the Distributed Computing Research
Laboratory of our University. The system was executed on an isolated network of
workstations, each of which equipped with a single CPU and running under a Linux
operating system. All computers had the same hardware and software, and were
configured in the same way — we use the same binary image for all hard disks. Every
component was run on a separate workstation as the only user process, all other
processes running were a few system processes started by default. The execution of
the system was initiated and terminated by the experiment team, which also controlled
that in the meantime nobody else had access to the facilities.
Data validation. Despite the data being collected reliably and objectively by
electronic means, it was thoroughly inspected to assert that it was consistent. For this
purpose we run the experiment three different times and compared the 3 data sets
obtained. However, it should be noted that only the first data set was subject to
analysis. Finally, there was no need to discard any data; hence all data collected was
used.
4. Analysis and Interpretation of the Results
After the execution of the experiment, all the measures were computed electronically
from the recorded data. The empirical data was analysed with the assistance of the
software package SPSS [19].
99

4.1. Descriptive statistics
Table 2 presents the minimum, maximum, mean and standard deviation of TBT and
the design measures for the system we analysed. These descriptive statistics are not
only useful to clarify the current study, but also comparisons will made easier in
future replications of this study.
Table 2. Descriptive Statistics (n=21)
Attribute Measure Minimum Maximum Mean Std. Dev.
NCoOPD 0.00 1.00 0.71 0.46
NCoOID 0.00 1.00 0.14 0.36
NClOPD 0.00 3.00 1.43 1.08
Structural
Coupling
(Design)
NClOID 0.00 2.00 0.24 0.62
NSyI 0.00 31.00 6.76 8.38
SyIL 0.00 3.00 1.43 1.21
NAvI 0.00 31.00 6.76 8.38
AvIL 0.00 3.00 1.43 1.21
NStI 0.00 5.00 0.62 1.36
Behavioural
Coupling
(Design)
StIL 0.00 1.00 0.29 0.46
Efficiency (Quality)
TBT 0.00 15.98 4.29 4.46
Discussion. NSyI, NAvI, NStI and all structural measures are simple counts, hence
their values are non-negative integer numbers and their minimal value is zero. All
measures were defined and validated on the ratio scale [7]. TBT is a measure of time
and its units are seconds per hour. The measures NCoOIPD and NClOIPD have less
than five observations that are non-zero. Therefore they were excluded from further
analysis. (This approach is also followed in [20]).
4.2. Correlation Analysis
The data was evaluated using the Shapiro-Wilk test to verify whether the data was
normally distributed. As the results confirmed that all measures were not normally
distributed, a non-parametric statistic was used. Tables 3 and 4 present the
Spearman’s correlation coefficients (significant at the 0.01 level) between the design
measures and efficiency (measured by TBT). The coefficients of non-significant
correlated measures are not shown, they have been substituted by a *. These measures
will not be considered in further analysis.
Table 3. Correlation coefficients between
structural measures and TBT
Table 4. Correlation coefficients between
behavioural measures and TBT
NClOPD NCoOPD
0.96 0.79
NSyI SyIL NAvI AvIL NStI StIL
0.89 0.77 0.89 0.77 * *
100

Discussion. The results show that most of the associations are statistically significant.
The correlation coefficients are significant, indicating a nontrivial association of the
measures with efficiency. This suggests that these variables are candidates for a base
regression model to estimate efficiency. Examination of the coefficients indicates that
all design measures are positively correlated to TBT — it should be noted that a
higher value of TBT indicates worse efficiency. StIL and NStI did not have common
values, therefore, a weak association was not surprising.
4.3. Univariate Regression Analysis
In this section, we present the results obtained when analysing the individual impact
of the design measures on efficiency using Ordinary Least Squares Regression [21].
In general, a multivariate linear regression equation has the following form:
Y = B
0
+ B
1
X
1
+ ... + B
n
X
n
(1)
where Y is the response variable, and X
i
are the explanatory variables. A univariate
regression model is a special case of this, where only one explanatory variable
appears.
Tables 5 and 6 present the unstandardized regression coefficients (B
i
), the
statistical significance of B
i
(p), and the goodness-of-fit (R
2
) of models. Each row
contains the statistics of a different univariate regression model.
Table 6. Univariate Behavioural Models
Table 5. Univariate Structural Models
X
i
B
0
B
1
p R
2
NClOPD -10.66 37.52 0.000 0.82
NCoOPD 0.00 60.11 0.002 0.39
X
i
B
0
B
1
p R
2
NSyI 9.71 4.91 0.000 0.85
SyIL 9.14 23.65 0.002 0.41
NAvI 9.71 4.91 0.000 0.85
AvIL 9.14 23.65 0.002 0.41
Discussion. The results obtained are remarkably consistent. They indicate that all
measures that we considered in this section (namely, NCoOP, NClOP, NSyI, SyIL,
NAvI, and AvIL) indeed strongly correlate with efficiency. In addition, by analyzing
the trends indicated by the coefficients, we see that the hypotheses underlying the
measures are empirically supported. Components and clusters with lower coupling are
indeed more efficient. In the best case, in our environment, distributed coupling (
measured by NSyI) accounted for 85 percent of the variation in efficiency (measured
by TBT), and each increase of one unit of coupling increased the TBT by 4.91
seconds (per hour).
4.4. Multivariate Regression Analysis
Tables 7 and 8 provide the estimated regression coefficients (B
i
) and their
significance (p) based on a t test, for the structural and behavioural measures after
performing stepwise multivariate linear regression [22]. It is important to note that we
101
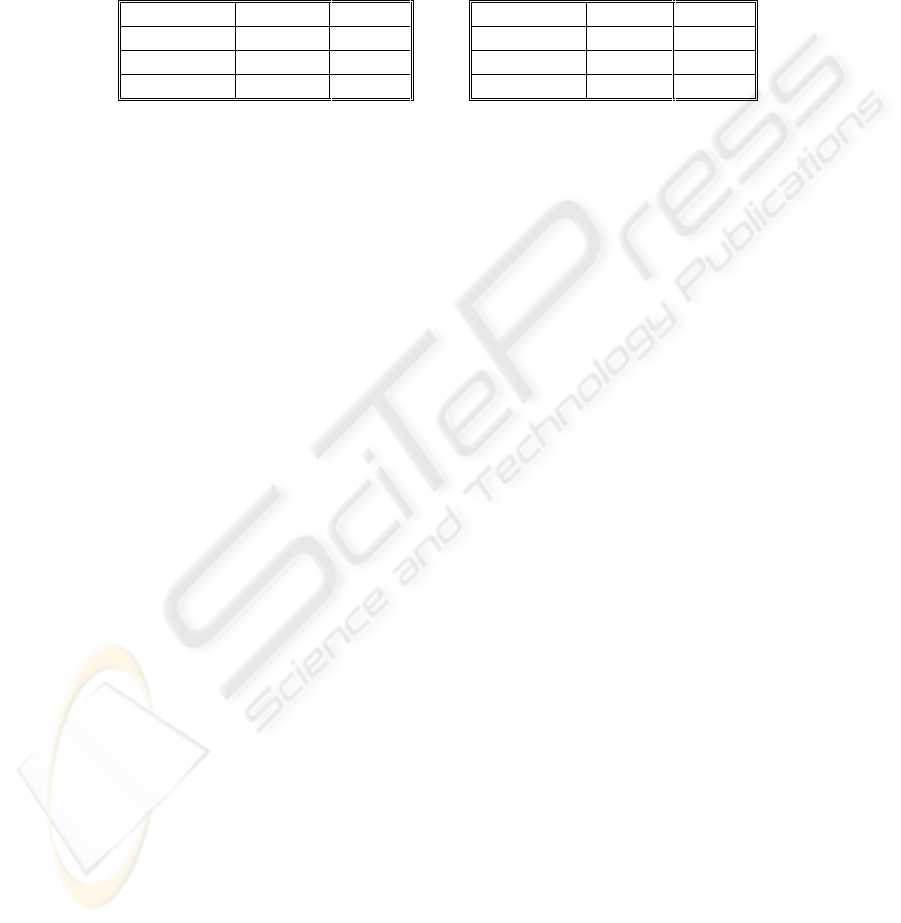
do not expect design measures to account for all the variation of efficiency, since
other factors, such as network bandwidth, are likely to be important too. However, the
goal of multivariate analysis is to determine whether the measures appearing
significant in the univariate analysis are complementary and useful for estimation.
Table 7. Multivariate structural model
(R
2
=0.91)
X
i
B
i
p
(Constant) 0.000 > 0.01
NCoOPD -57.089 0.000
NClOPD 58.853 0.000
Table 8. Multivariate behavioural model
(R
2
=0.92)
X
i
B
i
p
(Constant) -0.581 > 0.01
NSyI 4.239 0.000
SyIL 10.398 0.002
Discussion. Behavioural measures outperform slightly structural measures, but
estimations from structural measures are available earlier usually. The fact that p >
0.01 for B
0
only means that we cannot conclude that B
0
+RZHYHU ZH FDQ
realistically conclude that is very unlikely that B
1
DQG %
2
7KXV LW LV YHU\
likely that X
1
and X
2
are correlated to efficiency. The multivariate models show a
better fit than univariate models, so the measures are deemed to be potentially useful
for building a multivariate model to predict efficiency. Another important point is that
in this study, we were interested in the goodness of fit of the models, and we did not
investigate the predictive capability of the models per se. However, a satisfactory
goodness of fit is required in order to realistically expect a satisfactory predictive
capability in future studies [15].
The analysis of residuals is a simple yet powerful tool for evaluating the
appropriateness of regression models [20]. Therefore, the underlying assumptions
have been evaluated:
• Homogeneity of the error term variance. This assumption holds since the plot
of standardized residuals against the standardized predicted values shows a
random scatter of points and no discernible pattern was identified.
• Independence of the error term. We tested this assumption with a Durbin-
Watson test that did not reveal a significant correlation between residuals.
• Normality of the error term distribution. A visual inspection of the histogram
and the normal probability plot of the residuals indicated clearly that this
assumption is tenable.
Finally, NAvI and AvIL are not included in the behavioural model because they
present multi-colinearity problems with NSyI and SyIL.
4.5. Threats
Four different threats to the validity of the study should be addressed [11]:
• Conclusion validity. An issue that could affect the statistical validity of this
study is the size of the sample data, which may not be large enough for a
conclusive statistical analysis. We are aware of this, so we do not consider
these results to be final.
102

• Construct validity. The study was carefully designed, and the design was
piloted several times before actually being run. The quality measures are times,
which can be objectively and reliably measured. The design measures used in
this study were shown to adequately quantify the attribute they purport to
measure [7].
• Internal validity. The study was highly controlled and monitored, so it is very
unlikely that undetected influences have occurred without our knowledge. The
instrumentation was trustworthy since the data was collected, and the measures
computed, electronically.
• External validity. Although the study is based on a real case, more studies are
needed using systems from different enterprise domains. We are aware that
more experiments with different platforms (e.g. computer and network
hardware, operating systems, etc.) and infrastructure (e.g. middleware type,
programming language) must also be carried out to further generalize these
results. As a first step in this direction, we replicated the experiment running
the system under another operating system (Windows). The results were highly
consistent with our original study.
5. Conclusions and future work
With any new technology or paradigm comes the necessity to re-assess the suitability
of methods and tools used in the past. The estimation of software quality attributes
will benefit from having suitable design measures, as the structure and behaviour of
DIS have a significant impact on quality the final product. In this paper we initiated
the process of empirically evaluating some of the available measures for the
estimation of DIS quality attributes, in this case efficiency. More research is
necessary to confirm these results and to test other possible and existing measures for
this domain. In this study we have investigated two research questions:
• Which of the considered design measures have, statistically and practically, a
significant relationship with the efficiency of DIS in terms of total blocking
time (TBT)?
• To what extent these measures can be used separately or in combination for the
estimation of efficiency in terms of TBT?
To the best of our knowledge, this is the first reported empirical study of design
measures for DIS and the second in the domain. We found that the results provide
promising signs to attempt further large-scale studies. The system used in this study is
relatively small but sufficient for an initial study. It is also likely that additional
application of the measures will suggest modifications to the suite as additional
understanding is achieved.
Further work will include replicating the study with larger DIS and evaluating the
measures against other quality attributes of interest such as reliability and
maintainability.
103

References
1. R. Pressman, “Software Engineering: a Practitioner’s Approach”, 5th Edition,
McGraw-Hill, 2001.
2. G. Colouris, J. Dolimore and T. Kindberg, “Distributed Systems: Concepts and
Design”, Third Edition, Addison-Wesley, 2003.
3. S. Shatz, “Towards Complexity Metrics for Ada Tasking”, IEEE Transactions on
Software Engineering, vol. 14, no. 8, 1988.
4. J. Cheng, “Complexity Metrics for Distributed Programs”, Proceedings of the
Fourth International Symposium on Software Reliability Engineering, 1993.
5. S. Morasca, “Measuring Attributes of Concurrent Software Specifications in Petri
Nets”, Proceedings of the Sixth International Software Metrics Symposium, 1999.
6. W. Tsuar and S. Horng, “A New Generalised Software Complexity Metric for
Distributed Programs”, Information & Software Technology, vol. 40, no. 5, 1998.
7. P. Rossi and G. Fernandez, “Definition and Validation of Design Metrics for
Distributed Applications”, Proceedings of Ninth International Software Metrics
Symposium, 2003.
8. S. Shatz, “Development of Distributed Software”, Macmillan, 1993.
9. I. Wijegunaratne and G. Fernandez, “Distributed Applications Engineering”,
Springer, 1998.
10. P. Rossi and G. Fernandez, “Estimating Dynamic Aspects of Distributed
Software Quality”, Proceedings of the Third Argentine Symposium on Software
Engineering, 2002.
11. C. Wohlin et al, “Experimentation in Software Engineering: an Introduction”,
Kluwer Academic Publishers, 2000.
12. B. Kitchenham et al, “Preliminary guidelines for empirical research in software
engineering”, IEEE Transactions on Software Engineering, vol. 28, no. 8, 2002.
13. V. Basili and D. Rombach, “The TAME Project: towards improvement-oriented
software environments”, IEEE Transactions Software Eng., vol. 14, no. 6, 1988.
14. Sun Microsystems, http://java.sun.com/j2ee/1.3/docs/, 2003.
15. L. Braind, S. Morasca and V. Basili, “Defining and Validating Measures for
Object-Based High-Level Design”, IEEE Transactions on Software Engineering,
vol. 25, no. 5,1999.
16. G. Fernandez and P. Rossi, “Measuring Distributed Software Quality: a First
Step”, Proceedings of the First Argentine Symposium on Software Eng., 2000.
17. L. Braind, S. Morasca and V. Basili, “An Operational Process for Goal-Driven
Definition of Measures”, IEEE Transactions Software Eng., vol. 28, no. 12, 2002.
18. ISO/IEC 9126-1, “Information Technology – Software product quality – Part 1:
Quality Model”, International Organization for Standardization, 2003.
19. SPSS Inc, “SPSS 8.0: User Guide”, Chicago, 1998.
20. K. El Emam et al, “The Confounding effect of Class Size on the Validity of OO
Metrics”, IEEE Transactions on Software Engineering, vol. 27, no. 7, 2001.
21. R. Freund and W. Wilson, “Regression Analysis”, Academic Press, 1998.
22. S. Chatterjee, A. Hadi, and B. Price, “Regression Analysis by Example”, Third
Edition, Wiley, 2000.
104
