
WIRELESS NETWORKS EFFICIENCY STUDY BASED ON
METEOROLOGICAL DATA MEASUREMENTS
P. Mariño, F. Machado, S. Otero
Electronic Technology Department. University of Vigo.
ETSEI (DTE) Lagoas Marcosende S/N, CP: 36200 Vigo, Spain
F.P. Fontán, C. Enjamio
Signal Theory and Communications Department. University of Vigo.
ETSET (TSC) Lagoas Marcosende S/N, CP: 36200 Vigo, Spain
Keywords:
Wireless Communications, Millimetre Wavelengths, Acquisition Systems, Performance Analisys.
Abstract:
Wireless access networks based in millimetre wavelength technologies are mainly impaired by rain. To eval-
uate the rain effects over a communication system, it is essential to know the temporal and spatial evolution
of rainfall rate. For this reason, it is necessary to develop an experimental network which provides the ade-
quate data to study, prevent and compensate the rain fade. In this paper, an experimental rain gauge network
is presented. This network comprises weather stations capable of measuring rainfall rate, temperature and
humidity. The paper first describes the experimental network for automatic data acquisition as a system based
in a distributed process. The design of the experimental network is explained in detail and finally the interest
in millimetre wavelength applications is pointed out.
1 INTRODUCTION
The space-time variability of rain intensities at local
scale is an essential input for a number of studies,
including the planning and management of drainage
(Moore et al., 2000; Casale and Samuels, 1998) and
telecommunications networks (Redaño and Lorente,
1993; COST, Final Report: Action 255, 2002; COST,
Memorandum of Understanding: Action 280, 2001).
In the field of meteorology and hydrology for ur-
ban areas, the requirements are for rainfall data with
very fine time and space resolution. For this reason,
a number of experimental campaigns to obtain data
from weather radars and rain gauge networks have
been developed in the past. The analysis of these data
contributes to a better knowledge about the local dis-
tribution of precipitation (Moore et al., 2000; Redaño
and Lorente, 1993; Holland, 1967; Niemczynowicz,
1988). In some cases, it is possible to take advan-
tage of these networks and use their data for stud-
ies in the field of telecommunications (Enjamio et al.,
2002a). In addition, the availability of similar net-
works placed in different climatic regions will permit
the cross comparison of the results about the spatial
structure of rain, and its influence in the performance
of radio telecommunication networks.
In the field of telecommunications, recent studies
have shown the suitability of using weather radars to
predict the impairments caused by rain over satellite
or terrestrial links (Crane, 1980; Mannes et al., 2002).
Moreover, in Europe there are about 80 weather
radars used for meteorological purposes. Images from
weather radars have also been used for the characteri-
zation of the spatial properties of rain (Goldhirsh and
Musiani, 1992).
The rainfall rate can change dramatically along
space and time particularly during convective events
(Redaño and Lorente, 1993). Because of this, the rain
fade suffered by a terrestrial or satellite link can not be
exactly predicted from a point measurement of rain-
fall rate recorded, for example, at the receiver site.
Since the link has a certain path length that could be
partially or totally immersed within the rain, the atten-
uation series can be calculated more accurately if in-
formation about the spatial distribution of rainfall rate
along the path is provided, for instance, by a weather
radar or a rain gauge network.
For the experiment described in this paper both
data sources are considered, a weather radar which
belongs to the Spanish Meteorological Office (SMO)
and a rain gauge network consisting in 20 tipping
bucket gauges located within the coverage of the
radar.
Current advances in electronic and communica-
tion technologies have permitted the development of
multifunctional sensor nodes with enhanced wireless
60
Machado F., Mariño P., P. Fontán F., Enjamio C. and Otero S. (2004).
WIRELESS NETWORKS EFFICIENCY STUDY BASED ON METEOROLOGICAL DATA MEASUREMENTS.
In Proceedings of the First International Conference on E-Business and Telecommunication Networks, pages 60-66
DOI: 10.5220/0001395600600066
Copyright
c
SciTePress
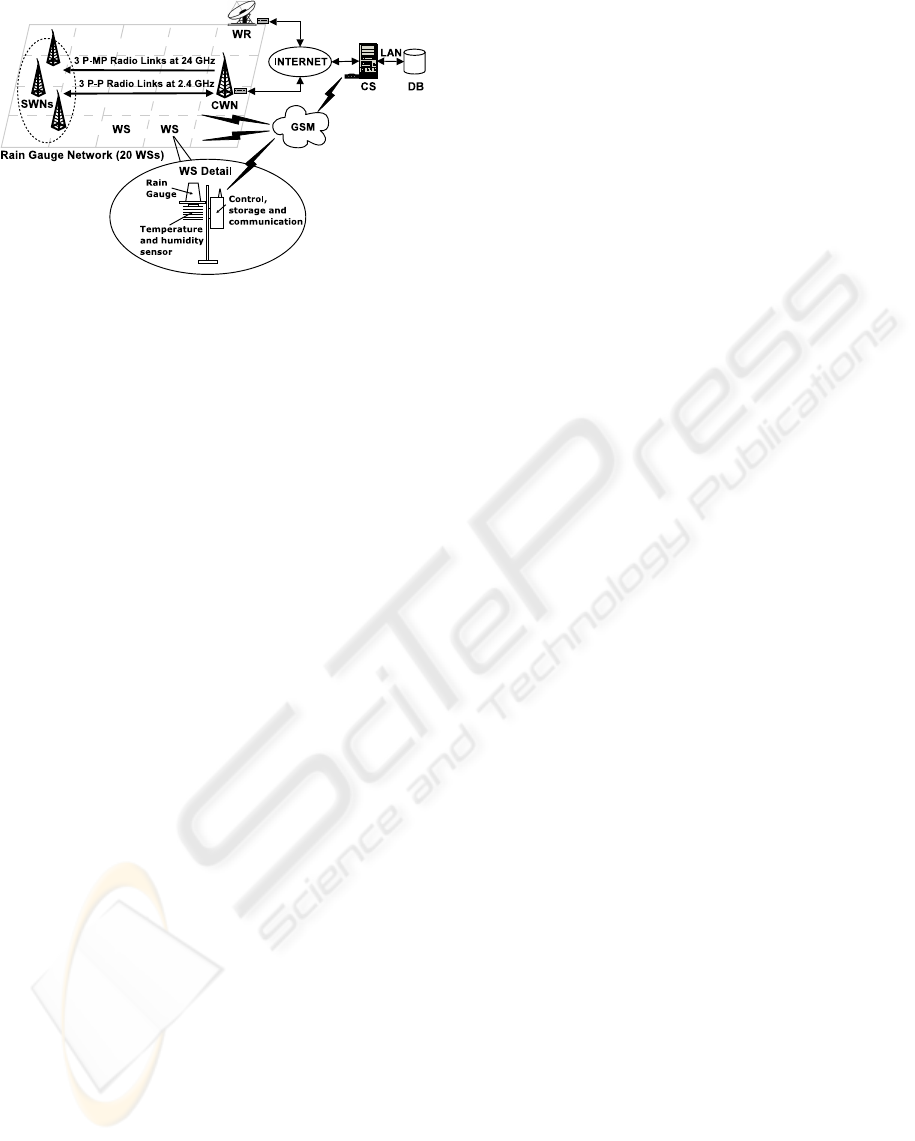
Figure 1: Weather station data Acquisition System (WAS)
structure for the rain gauge network.
communication capabilities (Akyildiz et al., 2002).
These nodes sense, process and transmit the data, en-
abling the development of automatic sensor networks,
which nodes are accessible from a wide area. These
communication capabilities allow the system data to
be remotely monitored and consulted. The implemen-
tation of a warehousing approach, allows data to be
stored in a centralized database system that is respon-
sible for query processing (Bonnet et al., 2000; Mar-
iño et al., 2003a). The stored data will be used in the
future to analyse the spatial and temporal variability
of the rainfall rate.
The paper describes first the different elements em-
ployed in the experiment. These included (i) the me-
teorological sub-network, (ii) the propagation sub-
network and (iii) the data management. The paper
progresses towards the application of these data to
performance studies of radio networks operating at
millimetre wavelengths.
2 DATA ACQUISITION SYSTEM
The Weather station data Acquisition System (WAS)
structure for meteorological variable measurement is
based on the GSM mobile telephony network, for
communications between control station (CS) and
weather stations (WS), and the Internet for commu-
nications with the weather radar (WR) and the central
wireless node (CWN) (Fig. 1).
In this system the following physical and logical
elements have been designed:
• Twenty weather stations with all their sensors and
structural elements necessary for their installation
in field.
• GSM, Internet and LAN networks access config-
uration, for data transmission and users queries
(Fig.1).
• Communication and data processing control station
(CS), that enables the information transfer between
weather stations and the database.
• Database (DB) for meterorological parameters
storage and analysis, and the corresponding inter-
faces.
• Data formats for meteorological information pro-
cessing, storage and modelling.
A second communication network has been su-
perimposed to the weather stations experimental net-
work, to study the precipitation impact on millime-
tre wavelength communication system. This second
network comprises the following physical and logical
elements:
• Three broadband radio links in a point-to-
multipoint (P-MP) configuration at 24 GHz formed
by three secondary wireless nodes (SWN), and one
central wireless node (CWN) with Internet connec-
tion.
• Three WLAN based point-to-point links at 2.4 GHz
between the CWN and the SWNs.
• Communication and data processing control soft-
ware for the CS.
• Database for propagation parameters storage and
its corresponding interfaces.
• Data formats for radio network propagation infor-
mation processing, storage and broadband service
planning.
Each weather station comprises a GSM modem that
transmits the meteorological information to the CS
through a data call. In order to reduce costs, the CS
makes a call to all the WSs every 24 hours by means
of a polling procedure. During these calls the WSs
send all the information that has been stored during
that period. On the other hand, the collected data from
the WR (radar images) and the CWN (radio links
state) are sent through direct connections to Internet,
under CS request. Therefore the CS periodically exe-
cutes the reading data process and later database stor-
age of the received information, through an Ethernet
local area network.
The Territorial Meteorological Centre, which be-
longs to the Spanish Meteorological Office (Fig. 2),
queries the database by Internet. Therefore, it is
possible to calibrate and compare the data from
the weather radar connected to the SMO, with the
weather station data from the experimental rain gauge
network. This allows to execute different applications
whose meteorological impact can be relevant (section
4).
2.1 Meteorological Data
The meteorological data sub-network consists on a C-
band weather radar and a rain gauge network com-
WIRELESS NETWORKS EFFICIENCY STUDY BASED ON METEOROLOGICAL DATA MEASUREMENTS
61
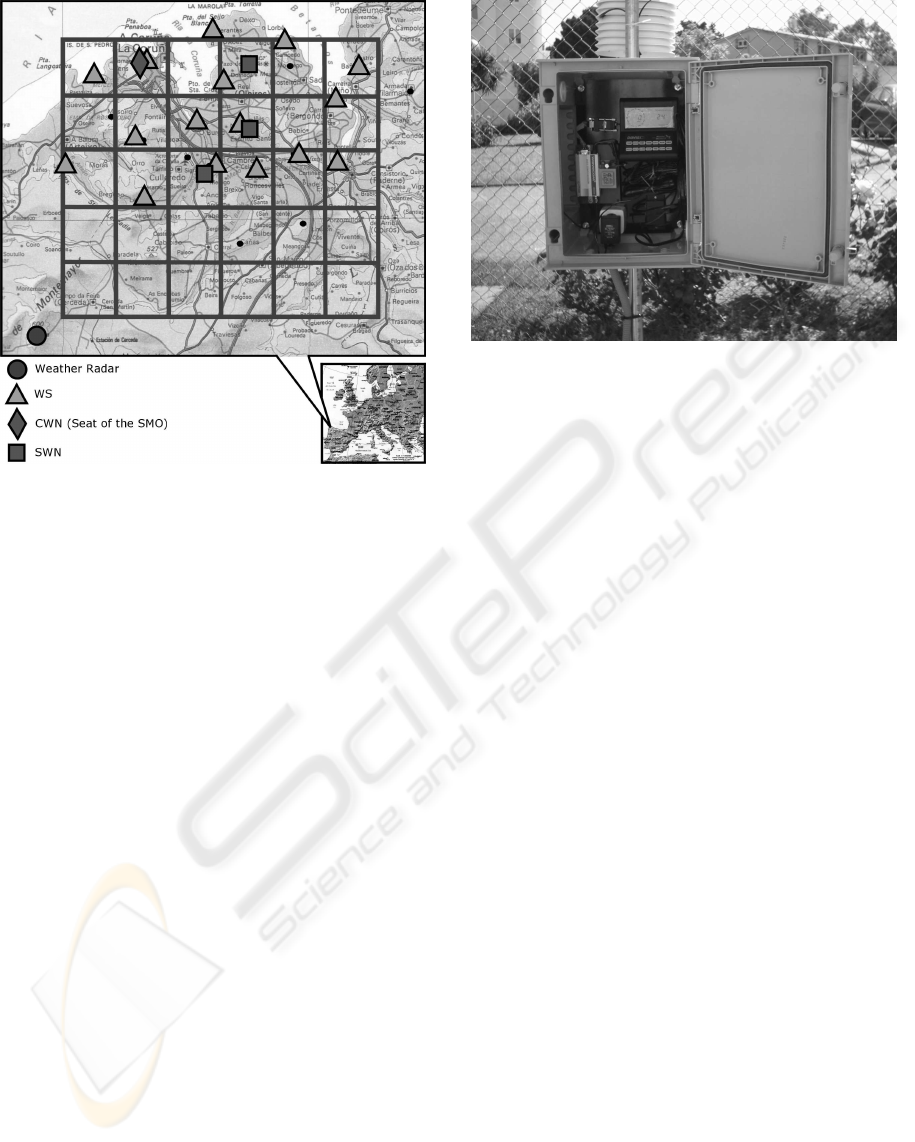
Figure 2: Weather station grid and weather radar location
map.
posed of 20 tipping-bucket gauges, located within the
radar coverage and in the surroundings of the city of
A Coruña (Northwest of Spain).
The weather radar belongs to the Spanish Meteoro-
logical Office and it is located on a hill 600 m above
sea level. The radar can operate in two modes: (i)
normal mode which provides a horizontal resolution
of 2 Km and (ii) Doppler mode with 1 Km resolution.
It performs twenty down-up scans resulting in a to-
tal time interval between two successive volumetric
scans of 10 minutes. The reflectivity data recorded by
the radar are then sent to the Regional Meteorological
Office through a radio link at 10 GHz.
The chosen topology for the rain gauge network
was a uniform grid of square cells. The cells have a di-
mension of 3x3 Km. Following this regular topology,
one weather station has been installed within each cell
to complete a total of 20 rain gauges (Fig. 2).
A weather station (WS) is the basic acquisition sys-
tem and carries out the data registration (measure-
ments and processing), and the communication with
the control station (CS). In this way, each WS com-
prises an automatic measurement unit with data trans-
fer capacity. Each WS is located within one of the
squares of the grid shown in figure 2.
The rainfall rate measurements are carried out by
an electronic tipping-bucket gauge with 0.1 mm tip
size. The rain drops are captured by a collector and
sent to a small bucket. When this bucket is full, it
tips out, closing an electronic circuit and sending an
Figure 3: WS data acquisition and communications system
assembled in the protection box.
impulse to the console.
The console is the system nucleus. It captures
the data from each sensor, automates the measure-
ments, synchronises the data and manages the com-
munications. The data transmission is carried out by
means of the data logger and the GSM modem con-
nected to the console. Next, the data captured by the
console is sent to the storage system where they are
saved. The communication process setting, through
the GSM modem connected to the data logger, per-
mits the control and programming of several tasks in
the console as well as the acquisition of the stored
data.
The data captured by the console are organised in
registers. The registers comprise the sensor outputs as
well as the time and date. These registers are then sent
to the storage system where they are saved for a future
access. The console is programmed for capturing and
storing the sensors information each minute. Due to
the limited capacity of the storage system integrated
in the WS, the data can only be stored during a day
(24 hours).
Figure 3 illustrates the console, the storage sys-
tem, the GSM modem and connections with the sen-
sors and the electrical supply. All these elements are
placed inside a box which protects them from the
weather conditions. This box as well as all the sensors
are fixed to a metallic base located at the site (Fig. 4).
2.2 Propagation Data
The second part of the experiment comprises the
study of the impairments caused by rain, in the ra-
dio communications systems working in the millime-
tre wavelengths. For this reason a sub-network com-
prising three radio links at 24 GHz has been installed,
ICETE 2004 - WIRELESS COMMUNICATION SYSTEMS AND NETWORKS
62
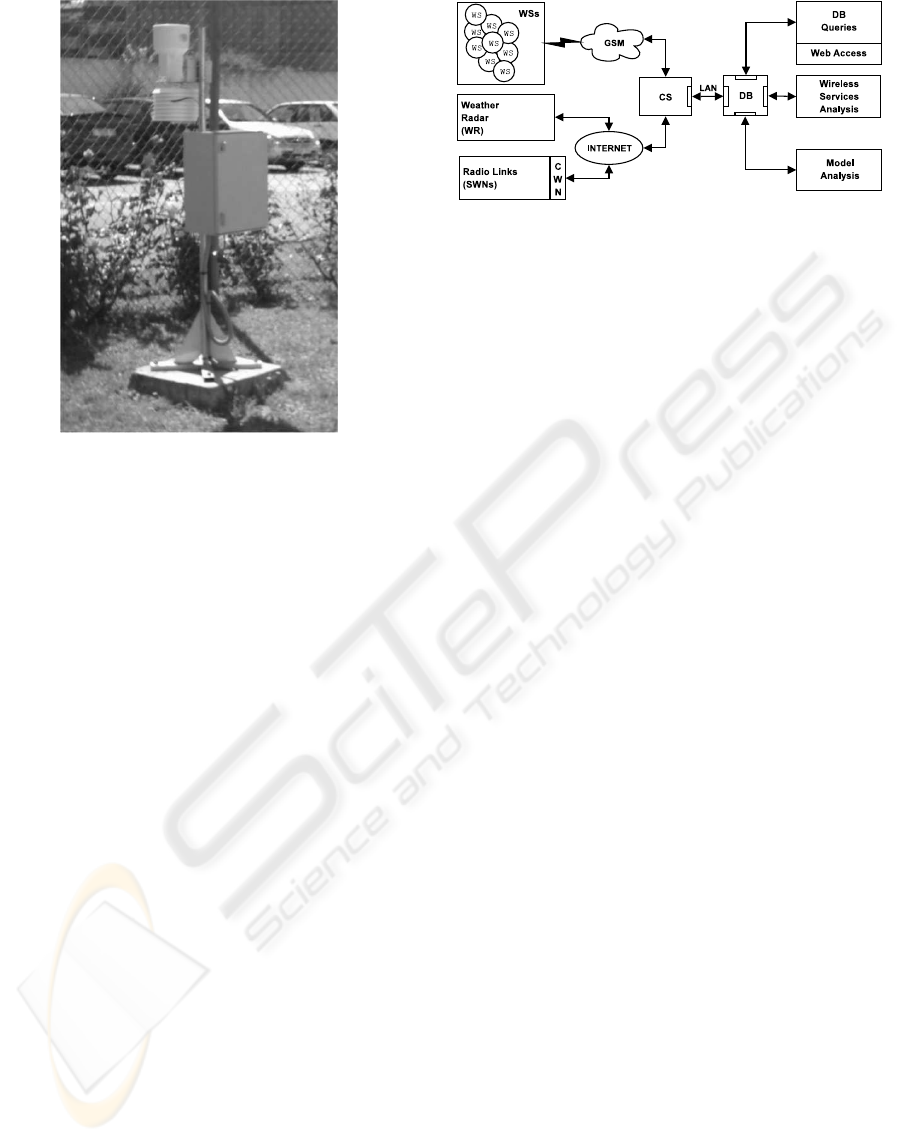
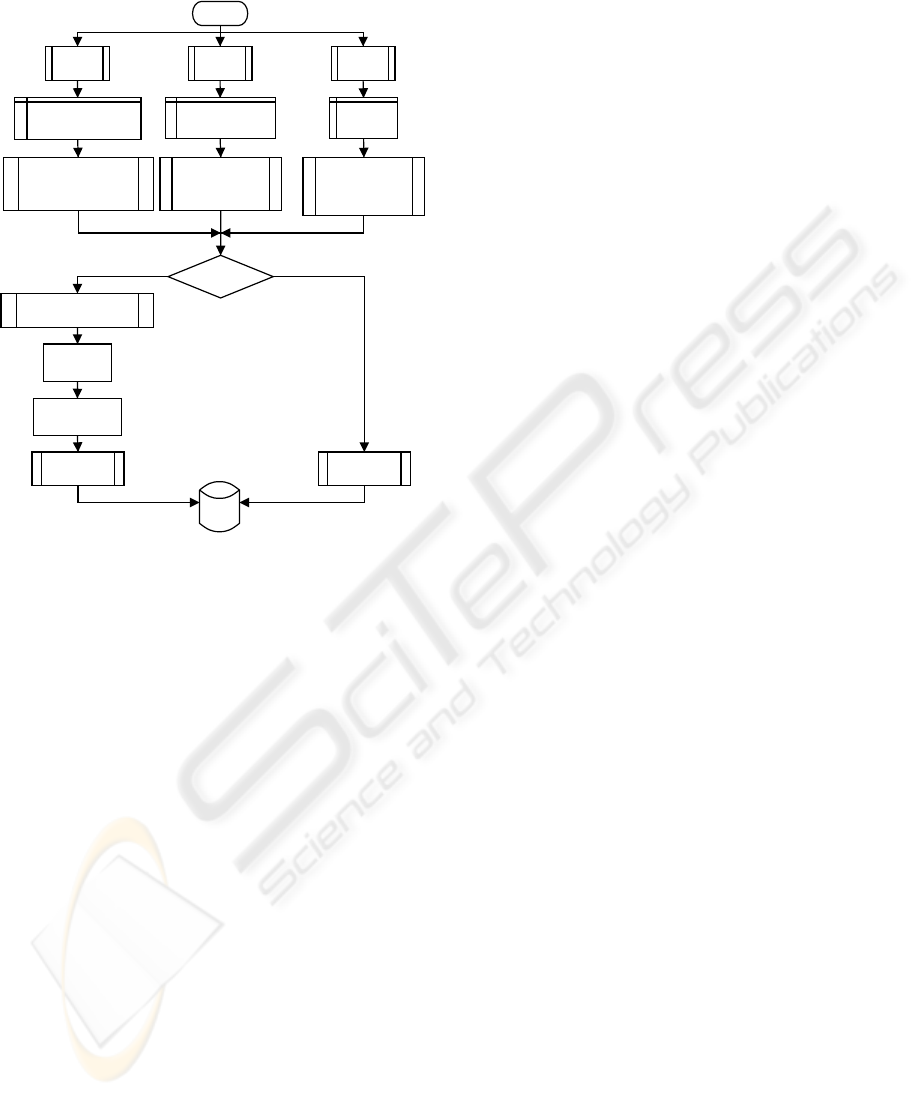
Figure 4: Final assembly and WS installation.
within the area covered by the meteorological data
network (Fig. 2). The topology was chosen to be
point-to-multipoint (P-MP) or divergent in order to
take advantage of the spatial structure of rain and the
path length is about 4 Km. Consequently, the links re-
produce a network configuration which benefits from
angular diversity. With this particular configuration,
it is possible to study the relationship or dependence
between the three attenuation series in terms of corre-
lation, angular-diversity improvement, etc. The ra-
dio links are unidirectional from the CWN to the
SWNs. The attenuation data registered at 24 GHz is
sent through a signalling channel at 2.4 GHz employ-
ing WLAN technology. The signalling channel is not
affected by rain and sends the attenuation registered
by the three links to the CWN, where it is again sent
to the CS through the Internet.
2.3 Global Data Management
The information obtained from the data acquisition
system (meteorological and propagation data) is col-
lected by the control station and stored in the database
for later process, analysis and query.
The CS requests and compiles the data from the
different elements of the developed system (Fig. 5) to
store them in the database. Thus the CS is provided
with a GSM modem to make the polling query of each
experimental WS in the network, and with an Inter-
net connection to check the radio link state from the
CWN, get the radar images from the WR and com-
municate with the DB.
Therefore the CS is a PC connected to GSM net-
Figure 5: WAS architecture and database interfaces.
work and Internet that executes the developed pro-
gram to perform its operations flowchart. The figure
6 shows this flowchart detailing the three basic tasks
of system data query: WSs, CWN and WR query.
Since all the measured data must have the same
time reference for its later process, the control station
obtains the system reference clock from a real time
network server by the NTP synchronization protocol
(Network Time Protocol). So after the data have been
obtained, a time synchronization test is verified for
the WSs, the CWN and the WR clocks, to determine
if the collected data can be considered valid. If this is
the case, the information is stored directly in the DB.
In the opposite situation, the problem is corrected (if
it is possible), it is notified by email and/or a SMS
message, and finally the data and the error informa-
tion are stored. In this way it is possible to known
exactly when and what type of errors took place and,
depending on this information, weather data can be
corrected.
The data from the weather stations network, the ra-
dio links and the WR are centralized in a relational
database. This DB presents one interface with the
CS, through which all the system information is in-
troduced, and three interfaces to access this informa-
tion: general data accesses, access to interesting data
to analyse the wireless services, and query of data to
obtain models (Fig. 5).
The interface between CS and DB is executed di-
rectly by means of calls, from the program running in
the CS, to the API functions of the database manage-
ment system (DBMS). This optimises the collected
data storage. However the queries do not have the
acquisition system restrictions (Mariño et al., 2003a)
and it is worth being generic interfaces. For this rea-
son this queries have been made by means of ODBC
(Open DataBase Connectivity).
The general data access will directly take place
through an Internet accessible web page. Whereas
for queries related to the analysis of wireless services
and models, the access is made through specific views
for each type of study (Mariño et al., 2003b). These
views (virtual cards) considerably facilitate the ser-
WIRELESS NETWORKS EFFICIENCY STUDY BASED ON METEOROLOGICAL DATA MEASUREMENTS
63
vices and models analysis.
WR
query
WR data
storage
WR state
verification
(Synchronization
and failure)
Start
WS
query
Weather registers
storage
WS state
verification
(Synchronization,
sampling and failure)
DB
Alarms
activation
CWN
query
Radio link state
storage
Errors?
Resynchronization
and reconfiguration
CWN state
verification
(Synchronization
and failure)
Notification
(email, SMS)
Temporary
Storage
Permanent
Storage
NO
YES
Figure 6: CS operations flowchart.
3 APPLICATION TO
BROADBAND RADIO
TECHNOLOGIES IN
MILLIMETRE WAVELENGTHS
The suitability of employing weather radars for prop-
agation studies in the millimetre wavelengths was
already pointed in the introduction. Nevertheless,
weather radar accuracy is mainly limited by two fac-
tors. First, the transformation of radar reflectivity
(Z) into rainfall rate (R) involves the assumption of
a certain Raindrop Size Distribution (RSD). Although
there are some well-known experimental RSD such as
the Marshall-Palmer or the Joss distributions, it has
been found that the RSD changes with the type of
storm (Vilar et al., 1997). The usual process to obtain
the rainfall rate consists in assuming a certain RSD
and obtaining the relation between Z and R. This pro-
cess may not be correct since it is based on the RSD
assumption which can not validated in practice.
Because of the availability of a rainfall rate
database provided by the rain gauge network, it is pos-
sible to "calibrate" the radar images with real rainfall
rate data.
The second radar limitation that must be taken into
account is the spatial and temporal resolution. The
weather radar used in this research provides a hor-
izontal resolution of 2 Km when it is operating in
normal mode and 1 Km when it operates in Doppler
mode. The time interval between two successive radar
volume scans is 10 minutes. The resolution can be
improved if a rain gauge network complements the
radar images because (i) the sensors are easy to in-
stall which permits getting the desired spatial resolu-
tion and (ii) in contrast with the radar images, the rain
gauges provide instantaneous rainfall rate data.
Weather radar limitations can then be reduced if
data from a rain gauge network is used. In addition,
the radar provides coverage in places where the instal-
lation of a rain gauge network is not feasible.
Attending the reasons above, the design of a rain
gauge network has been carried out as it was ex-
plained in section 2. The cells size was chosen to be
3x3 Km because of the similarity with previous ex-
periments (Moore et al., 2000; Enjamio et al., 2002a).
Nevertheless, the rain gauges are not uniformly ar-
ranged due to the difficulties to find the ideal sites,
and the distances between them are, in some cases,
smaller or bigger than 3 Km. In any case, the average
distance provides a ratio of at least one rain gauge ev-
ery two radar pixels. In addition, recent studies have
shown that this distance is enough to distinguish and
extract the structure and movement of the rain cells
(Enjamio et al., 2002b).
Some previous studies about the spatial distribution
of rainfall rate have illustrated the significance of us-
ing spatial data for the analysis/prediction of the be-
haviour of the telecommunications systems. Figure 7
shows an illustrative example of a measured attenua-
tion series carried out with the ITALSAT satellite at
39.6 GHz and the series calculated using rainfall rate
data from a dense rain gauge network (Enjamio et al.,
2002a).
The characterisation of the spatial distribution of
rainfall rates can be obtained from the radar images,
once calibrated using the rain gauges information.
Radar images can then be applied to the simulation
and analysis of the performance of communication
systems, fixed terrestrial or satellite, in the millimetre
wavelengths. This analysis will permit the design and
evaluation of numerous ways of optimising the com-
munications by adapting the transmission parameters
such as the transmitted power, coding or modulation.
The spatial and temporal characterisation of rain-
fall rates is also useful for the development of mi-
croscale/mesoscale precipitation models. These mod-
els can then be applied to a number of systems includ-
ing hydrology or communications.
The analysis of the spatial data provided by the
radar-gauges network will complement the avail-
able information obtained from similar experiments
ICETE 2004 - WIRELESS COMMUNICATION SYSTEMS AND NETWORKS
64
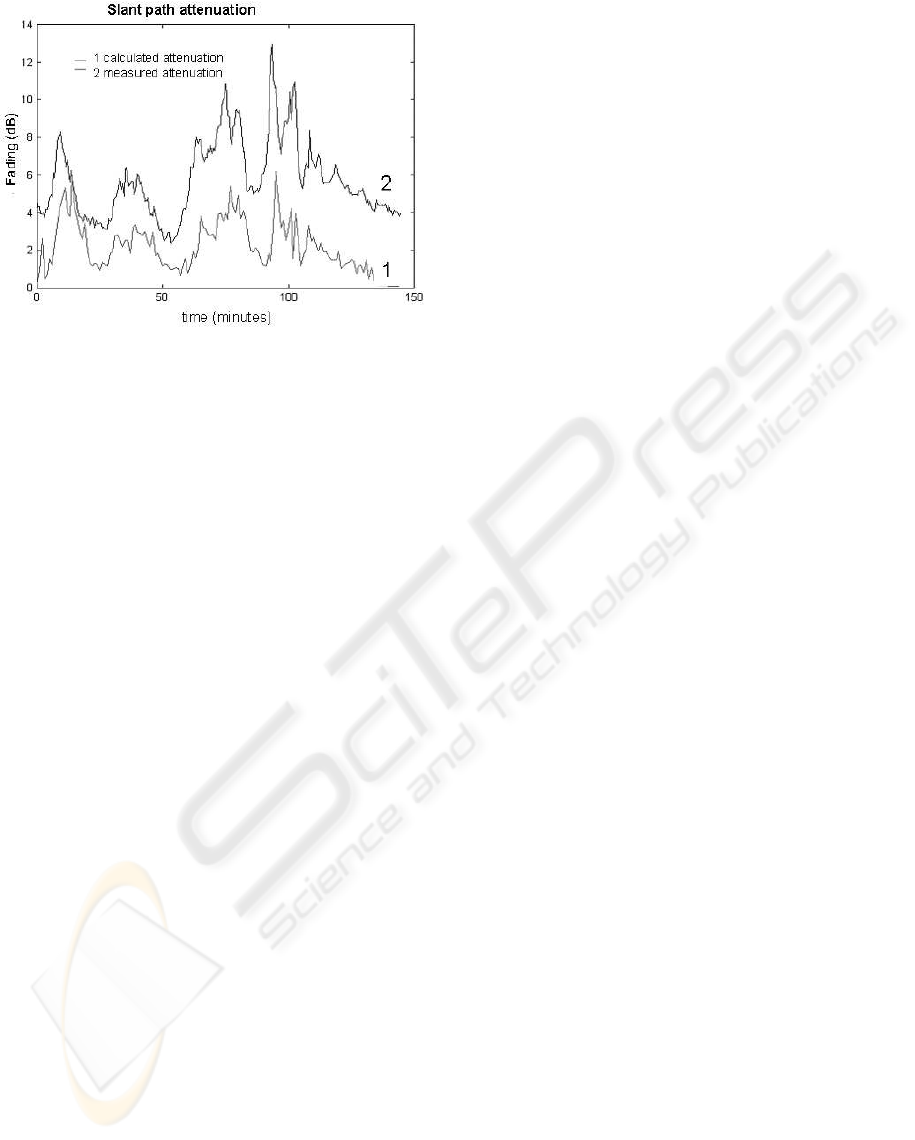
Figure 7: Comparison between measured and computed at-
tenuation for the same radio link. Barcelona ITALSAT. 41
o
elevation, 39.6 GHz.
(Moore et al., 2000; Enjamio et al., 2002a). This fact
will help to reduce the lack of results about the time-
space structure of rainfall rate at local scale.
4 CONCLUSIONS
The authors have designed a meteorological and prop-
agation data acquisition and storage system (WAS)
based on GSM network and Internet. This system
has been developed within the area covered by the
weather radar of the SMO, located in the neighbour-
hood of A Coruña (Spain). The WAS comprise a me-
teorological data sub-network formed, in addition to
the WR, by a grid of 20 weather stations within 3 Km
cells, and a propagation data sub-network formed by
three radio links at 24 GHz and the signalling channel
at 2.4 GHz (Fig. 2).
The aim of the WAS experiment is not exclusively
limited to the field of telecommunications and the
evaluation of the impairments caused by rain within
broadband wireless networks, like the studied one in
this article (section 3). For this reason the extension
to the general meteorology scope is taken into ac-
count, providing a web service where meteorological
data are available to all the users, and national or in-
ternational agencies related to environmental studies
in meteorology, hydrology, communications, natural
disasters prevention, etc.
In the scope of wireless optical technologies appli-
cations, also it is interesting the evaluation of optics
based services in free space (FSO) (Dornan, 2002).
Also, in the radio communications scope, it is
predicted to extend the study to other radio net-
works services such as: satellite distribution net-
works, satellite data networks with small aperture an-
tennas (VSAT), stratospheric platforms (HAPs) (Har-
ris, 2000), aeronautical services, fleets radio commu-
nication (TETRA), mobile networks without infras-
tructure (MANET), etc.
ACKNOWLEDGMENTS
This work has been sponsored by two R&D projects
from the following entities: Research General Di-
rectorate of the MCYT, Ref. TIC2001-3701-C02-
01, Central Government (Madrid, Spain); and Presi-
dency Department, Ref. PGIDT01TIC30301PR, Au-
tonomous Government (Galicia, Spain).
REFERENCES
Akyildiz, I., Su, W., Sankarasubramaniam, Y., and Cayirci,
E. (2002). Wireless sensor networks: a survey. Com-
puter Networks, 38(4):393–422.
Bonnet, P., Gehrke, J., and Seshadri, P. (2000). Querying
the physical world. IEEE Personal Communications,
pages 10–15.
Casale, R. and Samuels, P. (1998). Hydrological risks:
Analysis of recent results from ec research and tech-
nological development actions. Technical report, Eu-
ropean Commision. Environment and Climate Pro-
gramme.
COST, Final Report: Action 255 (2002). Radiowave propa-
gation modeling for new satcom services at Ku-Band
and above. Technical report, Commission of the Eu-
ropean Communities, Brussels.
COST, Memorandum of Understanding: Action 280
(03/21/2001). Propagation impairment mitigation for
millimetre wave radio systems. Technical report,
Commission of the European Communities, Brussels.
Avaliable online. http://www.cost280.rl.ac.uk.
Crane, R. (1980). Prediction of attenuation by rain. IEEE
Transaction on Communications, COM-28(9):1717–
1733.
Dornan, A. (2002). Wireless optics: fiber is cheap, but space
is free. Network Magazine, pages 28–32.
Enjamio, C., Vilar, E., and Fontan, F. (2002a). Rainfall rate
spatial distribution at local scale: Rain cell analysis in
the mediterranean region. In URSI Open Symposium
on Propagation and Remote Sensing, Garmisch, Ger-
many.
Enjamio, C., Vilar, E., and Fontán, F. (2002b). Consider-
ations on short distance diversity gain and dynamic
rain fade. In 20th AIAA International Communication
Satellite Systems Conference and Exhibit, Montreal,
Quebec, Canada.
Goldhirsh, J. and Musiani, B. (1992). Dimension statis-
tics of rain cell cores and associated rain rate isopleths
WIRELESS NETWORKS EFFICIENCY STUDY BASED ON METEOROLOGICAL DATA MEASUREMENTS
65

derived from radar measurements in the mid-atlantic
coast of the United States. IEEE Transactions on Geo-
science and Remote Sensing, 30(1):28–37.
Harris, S. (2000). Sky-high platforms propel telecoms to
new heights. Wireless Europe, pages 33–37.
Holland, D. (1967). The Cardington rainfall experiment.
The Meteorological Magazine, 96(1140):193–202.
Mannes, T., Fischer, C., Randeu, W., Kock, K., and Schon-
huber, M. (2002). Optimised satellite communica-
tions using weather radars. In 20th AIAA International
Communication Satellite Systems Conference and Ex-
hibit, Montreal, Quebec, Canada.
Mariño, P., Sigüenza, C., Poza, F., Vázquez, F., and
Machado, F. (2003a). Data warehouse filters and
power plant failure prediction models. In 7th IASTED
International Multi-Conference, Power and Energy
Systems, Palm Springs, California, USA.
Mariño, P., Sigüenza, C., Poza, F., Vázquez, F., Machado,
F., and Lamela, H. (2003b). Predictive maintenance
measurement system. In International Signal Process-
ing Conference (ISPC) & Global Signal Processing
Expo (GSPx), Dallas, Texas, USA.
Moore, R., Jones, D., Cox, D., and Isham, V. (2000). Design
of the HYREX raingauge network. Hydrology and
Earth System Sciences, 4(4):523–530.
Niemczynowicz, J. (1988). The rainfall movement - a valu-
able complement to short-term rainfall data. Journal
of Hydrology, 104:311–326.
Redaño, A. and Lorente, J. (1993). Modelling the spatial
and temporal distribution of rainfall intensity at local
scale. Theoretical and Applied Climatology, 47:25–
32.
Vilar, E., Montanari, C., Pontes, M., Mello, L. S., Lorente,
J., and Codina, B. (1997). Scattering and extinction:
Dependence upon raindrop size distribution in tem-
perate (Barcelona) and tropical (Belem) regions. In
10th International Conference on Antennas and Prop-
agation, number 436, pages 2230–2233, Heriot-Watt
University, Edinburgh, UK.
ICETE 2004 - WIRELESS COMMUNICATION SYSTEMS AND NETWORKS
66
