
BASELINE TO HELP WITH NETWORK MANAGEMENT
Mario Lemes Proença Jr., Camiel Coppelmans
State University of Londrina (UEL) – Computer Science Department (DC) – Londrina, PR - Brazil
Mauricio Bottoli, Leonardo de Souza Mendes
State University of Campinas (UNICAMP) – Communications Department (DECOM/FEEC) – Campinas, SP - Brazil
Keywords: Computer network management, bas
eline, traffic characterization.
Abstract: This paper presents a model for automatic generation of a bas
eline which characterizes the traffic of
network segments. The use of the baseline concept allows the manager to: identify limitations and crucial
points of the network; learn about the actual status of use of the network resources; be able to gain better
control of the use of network resources and to establish thresholds for the generation of more accurate and
intelligent alarms, better suited to the actual characteristics of the network. Moreover, some results obtained
with the practical use of the baseline in the management of network segments, are also presented. The
results obtained validate the experiment and show, in practice, significant advantages in their use for
network management.
1 INTRODUCTION
Computer networks are of vital importance
nowadays for modern society, comparable to
essential services like piped water, electricity and
telephone. Extensive work has been done to improve
ways to implement quality of services and traffic
management along the Internet backbone (
Duffield,
2001). Several existing tools and network
management systems (NMS) aim to help with the
network management and controls to reduce costs
and improve resource utilization. However, the
construction of a baseline suitable for the
characteristics of each segment of a network
backbone is an important task that is not usually
found in the network management systems.
The Baseline can be defined as the set of basic
in
formation that shows the traffic profile in a
segment of the network, through minimum and
maximum thresholds about volume of traffic,
quantity of errors, types of protocols and services
that flow through this segment along the day. The
real forecast or even an approximate one in a
determined instant about the characteristics of the
traffic of the segments that make up the network
backbone, make the management decisions on
problems that might be happening, more reliable and
safer (Thottan, 2003).
The use of the baseline can help the network
m
anager to identify limitations and control the use
of resources that are critical for services that are
latency-sensitive such as Voice over IP and video
transport, because they can’t take retransmission or
even network congestion. Besides improving the
resources control, its use also facilitates the planning
on the network increase, for it clearly identifies the
real use of resources and the critical points along the
backbone, avoiding problems of performance and
fault that might happen.
The use of the baseline also offers the network
m
anager advantages related to performance
management, by means of the previous knowledge
of the maximum and minimum quantities of traffic
in the segment along the day. This enables the
establishment of more effective and functional
alarms and controls, because they are using
thresholds that suit the baseline, respecting the
variations of traffic along the day instead of using
the linear thresholds that are set based on the
expertise of the human network manager (Hajji,
2003). Deviations in relation to what is being
monitored real-time and what the baseline expresses
must be observed and analyzed carefully, and can or
can not be considered as problems. In order to do
152
Lemes Proença Jr. M., Coppelmans C., Bottoli M. and de Sousa Mendes L. (2004).
BASELINE TO HELP WITH NETWORK MANAGEMENT.
In Proceedings of the First International Conference on E-Business and Telecommunication Networks, pages 152-160
DOI: 10.5220/0001395501520160
Copyright
c
SciTePress
that, the use of an alarms system integrated to the
baseline and to the real-time monitoring will deal
with these problems, warning the network manager
when it is necessary.
As for security management, the use of the
baseline can offer information related to the analysis
of the users behavior, because the previous
knowledge of the behavior and the traffic
characteristics of a determined segment is directly
related to the profile users manipulation, using this
as information to prevent intrusion aspects or even
network attacks, by means of the intrusion detection
software (Northcutt, 2002) (Cabrera, 2001).
Another application for the baseline is related to
the monitoring of a network segment which is
normally performed manually by means of visual
control, based on empirical knowledge with the
network acquired by the manager. An example of
this can be seen with the utilization of tools like
GBA (Automatic Backbone Management) (GBA,
2004) and MRTG (Multi Router Traffic Grapher)
(MRTG, 2004) that generate graphs with statistical
analysis which consist of averages along a
determined period of time about an analyzed
segment or object. However, the simple use of these
graphs establishes limitations for the network
manager concerning to discovery and solution of
problems. The limitations are caused especially by
the non-automation of this task, where the
monitoring of these graphs is performed visually,
depending exclusively on the empirical knowledge
about the functioning of the network acquired by the
manager and due to the large quantity of graphs that
have to be analyzed continuously. It only allows the
detection of the problems and unusual situations in a
reactive way.
Networks with a great number of segments turn
their management more complex, considering the
great quantity of graphs to be analyzed. The graphs
usually present information on the volume of input
and output of traffic of a certain segment, not
aggregating information that could help the manager
more efficiently in his decision-making with the
purpose of solving problems that might be
happening or that might have already happened.
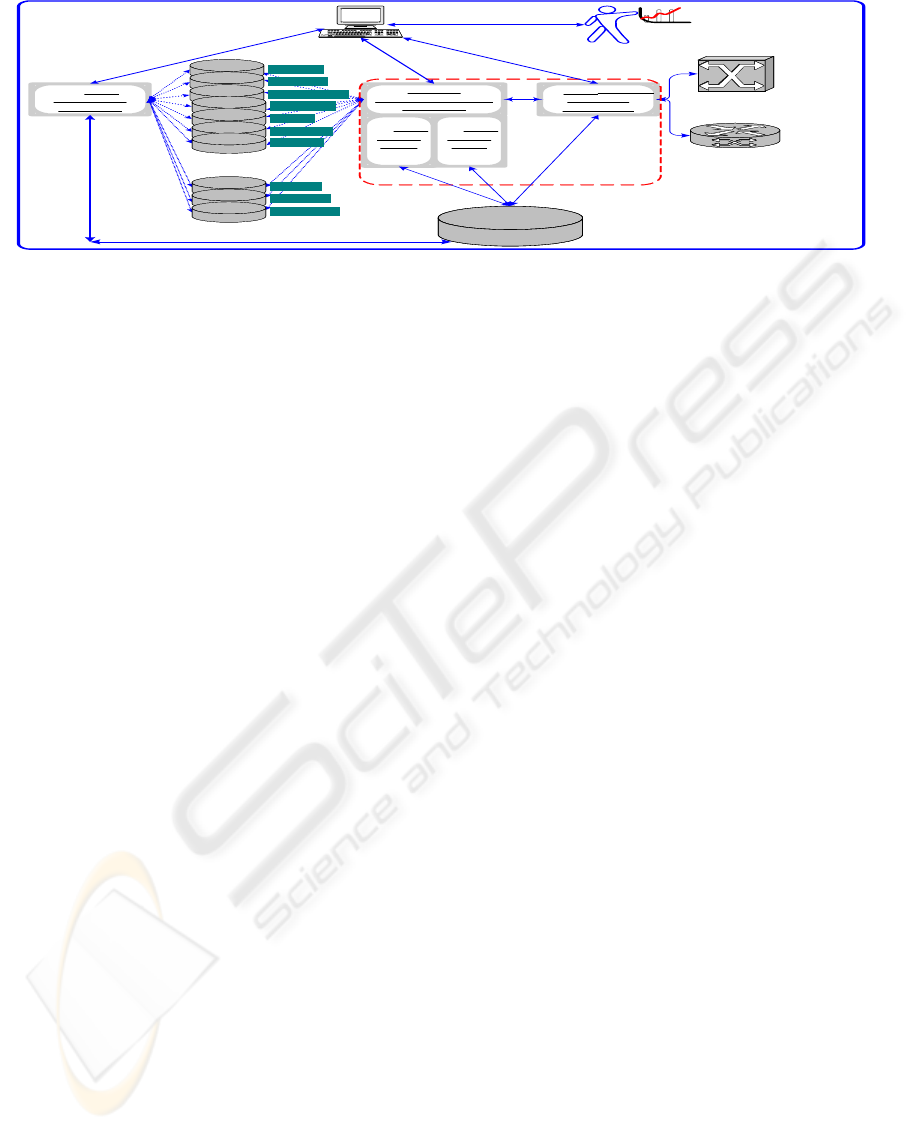
(b ) G B A
generates A larm s
B aseline
m anagem ent station
(a ) G B A
generates
B aseline
N etw ork adm nistrator
network alarm s and
analytical reports
Baseline of days of
the w eek (bl-7)
(c ) GBA collects
sam ples
fro m M IB
..
(d ) G B A
cheks
IQ B L
B aseline
sunday
saturday
Workdays
W orkdays Baseline
( bl-3)
M onday
Tuesday
W ednesday
Thursday
Friday
Saturday
Sunday
(e ) G B A
cheks
IV B L
Baseline
ATM backbone
router
ATM
backbone
Switch
daily, m onthly, yearly database
s a m p le fro m M IB
(0,4 M byte/day per segm ent/object)
Figure 1: Operational functioning diagram for the generation of baseline and alarms.
Extensive work has been done in traffic
characterization (Rueda, 1996), traffic measurement
(Dilman, 2002) and anomaly detection (Hajji, 2003)
(Thottan, 2003) (Papavassiliou, 2000), that is related
to the proposal in this work. In (Rueda, 1996) is
presented a survey of the main research done for
traffic characterization in telecommunication
networks. However these models intend to traffic
modeling in a generic way, while the proposal
presented in this paper intends to a traffic
characterization generated from collected real data
of each segment of analyzed network.
In (Hajji, 2003) is presented a proposal that is
close to ours presented in this work, they proposed a
baseline for automatic detection of network
anomalies that uses asymptotic distribution of the
difference between successive estimates of a model
of network traffic. One problem that exists in this
model is that it assumes that the training data is pure
with no anomalies. In our case we calculate the
baseline based on real data gathering from the
network segment. Our baseline is generated based
on statistical analyses of these data.
Thottan et al (Thottan, 2003), presents a review
about anomaly detection methods and a statistical
signal processing technique based on abrupt change
detection that uses analysis of SNMP MIB variables
for anomaly detection. They use a 15s sampling
frequency, and it assumes, like an open issue, that
there exist some changes in MIB data that don’t
correspond to network anomalies. The use of an
effective and real baseline can help to solve this
problem for knowing the real behavior of the traffic.
Papavassiliou et al.(Papavassiliou, 2000),
presents a tool with intend to facilitate the network
management, reducing costs and minimizing the
human errors. They use a similar approach to ours
for the construction of baselines, when they separate
workdays from weekends.
In the rest of this paper it will be presented a
description about the model proposed for the
construction of the baseline, the way it was
BASELINE TO HELP WITH NETWORK MANAGEMENT
153
implemented and the results that show practical
gains for the network management. At last, in
section 3 we conclude and mention suggestions for
future works.
2 BASELINE IMPLEMENTATION
The main purpose to be achieved with the
construction of the baseline is the characterization of
the traffic of the segment it refers to. This
characterization should reflect initially the profile
expected for the traffic along the day as well as
other existing characteristics such as: types of
protocols, types of applications, types of services.
These characteristics are used to create a profile of
the users. The baseline was initially developed to
analyze the quantity of input and output of octates
stored in the ifInOctets and ifOutOctets objects
which belong to the Interface group of the MIB-II
(RFC-1213, 1991).
The use of the GBA tool (Automatic Backbone
Management) was chosen as a platform for the
development of the baseline due to the great
quantity of historical information related to
monitoring carried out along the last years in the
main network segments of UEL. The GBA was
initially developed to help with the network
management with ATM backbone and it performed
its duty as it became a platform of learning and
development, helping with the management as well
as with the understanding about the networks
functioning. Further information on the GBA can be
found at http://proenca.uel.br/gba or in (Proença,
2001).
As for the tests and validation of the model, the
data gathered by the GBA have been used since
2002 up to the present. The use of the data from the
last two years was considered an important sample,
characterized by periods of winter and summer
vacations as well as holidays which contributed to
the tests and validations of the ideas presented in
this work. The analyzed data is related to the
network segments with traffic TCP/IP based on
Ethernet and ATM with LAN Emulation. The tests
of the proposed model were carried out in three
segments of the network backbone of UEL which
are described below:
1. The first one which is called segment S
1
is
responsible for interconnecting its ATM
router to the other backbone segments; it
gathers a traffic of approximately 2500
computers;
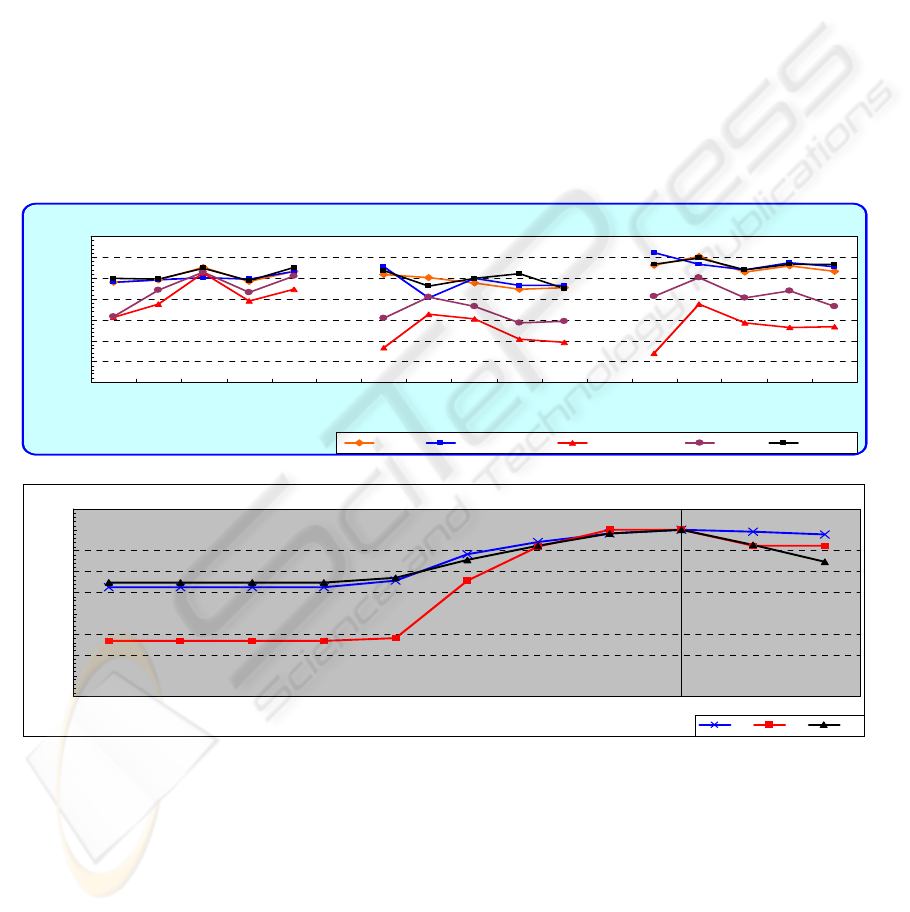
Linear regression analysis to choose the best baseline
0.65
0.70
0.75
0.80
0.85
0.90
0.95
1.00
Mo n
Tue
We d
Thu
Fri
Mo n
Tue
We d
Thu
Fri
Mo n
Tue
We d
Thu
Fri
Correlation (R)
Mean
Czuber Mode
Decile mean
Octile
BL-GBA
September October November
Baselines:
Figure 2: Linear regression analysis aiming at evaluating which is the best method for baseline generation.
Prove of the BLGBA 80% index
0,80
0,83
0,85
0,88
0,90
0,93
0,95
0,98
1,00
1,03
0% 10% 20% 30% 40% 50% 60% 70% 80% 90% 100%
Index used to create the baseline/DSNS BLGBA
Correlation (R)
S1
S2
S3
Figure 3: Linear regression analysis aiming at validating the choice for the index of 80% for the BLGBA.
2. The second one which is called S
2
interconnects its office for undergraduate
studies of academic affairs; it gathers a
traffic of 50 computers;
3. The third one which is called S
3
interconnects State University of Campinas
UNICAMP network to academic network
at São Paulo (ANSP), it gathers a traffic of
ICETE 2004 - SECURITY AND RELIABILITY IN INFORMATION SYSTEMS AND NETWORKS
154
all UNICAMP (about 5000 computers) to
Internet.
For the generation of the baseline a model was
developed based on statistical analyses that we call
BLGBA. The analyses were carried out for each
second of the day, each day of the week. Figure 1
illustrates the operational diagram used in the
implementation of the baseline, which is carried out
by the
GBA generated baseline module. This
module reads information from the database with
data gathered daily and generates the baseline based
on a period requested by the network manager.
Two types of baseline were created, one called
bl-7 which consists of seven baseline files, one for
each day of the week, and the other one called bl-3
which consists of three baseline files, one for the
workdays from Monday to Friday, one for Saturday
and another one for Sunday, as shown in Figure 1.
The choice for generating the baseline separating the
workdays of the week from Saturday and Sunday,
was in order to minimize the margin of error in the
final result, concerning the alterations in the volume
of traffic that occur between the workdays and the
other days. The results showed that it was the right
choice, because the variation that was found in the
volume of traffic between the workdays was of 10%
and over 200% comparing workdays and weekends,
as can be seen in figure 4.
The model for baseline generation proposed and
presented in this work, performs statistical analysis
of the collected values, respecting the exact moment
of the collection, second by second for twenty-four
hours, preserving the characteristics of the traffic
based on the time variations along the day. For the
generation of the baseline, the holidays were also
excluded due to the non-use of the network on these
days. Moreover, the process of baseline generation
also considered faults in the collected samples which
occur along the day, eliminating these faults from
the calculations for the baseline generation.
The GBA makes collections at each second at the
MIBs of the network equipments. Along each day,
86400 samples are expected. Problems usually occur
and may affect some of these samples due to the loss
of package or congesting in the network. In this
case, for the generation of the baseline, the
exclusion of these samples was chosen in the
calculation of the baseline related to that second.
This problem occurs in less than 0.05% a day, for
the analyzed samples.
The processing for the baseline generation is
done initially in batch aiming at its creation through
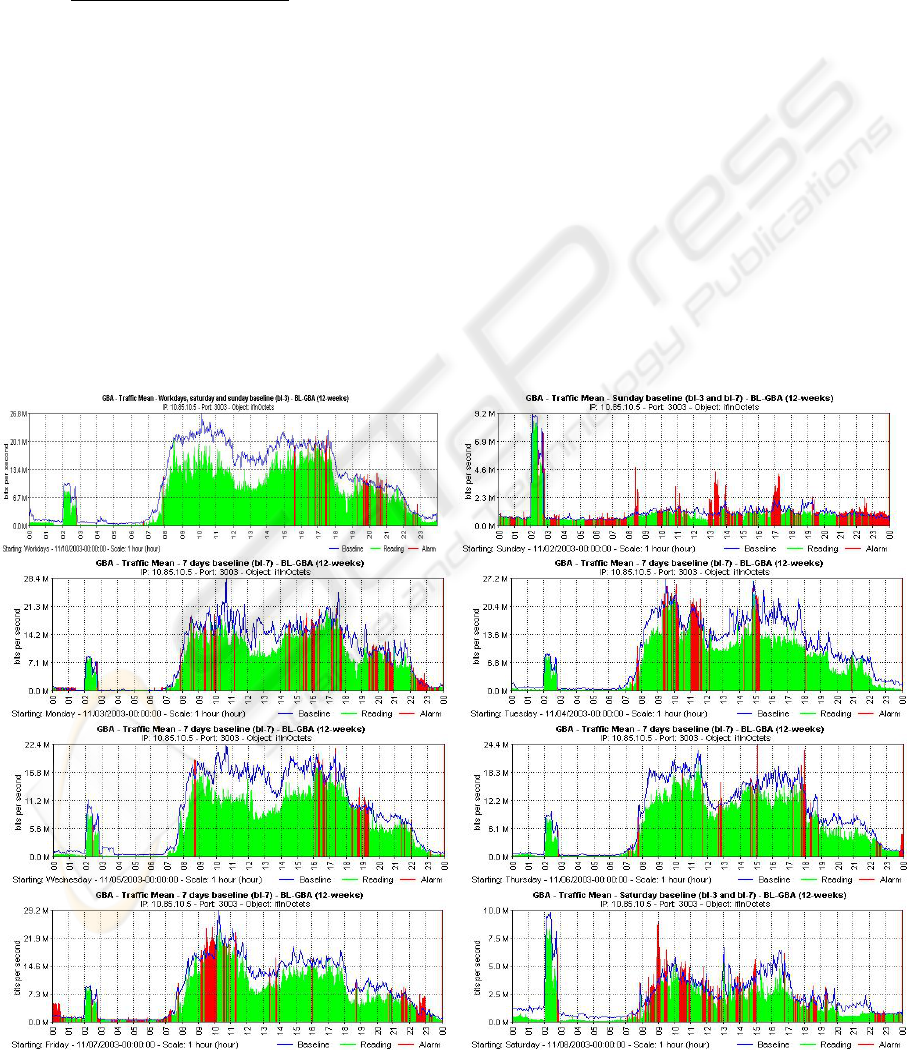
(a) (b)
(c) (d)
(e) (f)
(g) (h)
Figure 4: Baseline and the daily movement for S
1
segment analyze.
BASELINE TO HELP WITH NETWORK MANAGEMENT
155

data related to a pre-established period. The baseline
is generated second by second for a period of days
represented by N which makes up the set n
j
(j = 1, 2,
3, 4, ..., N); with the daily gathering there is a set of
samples of the day represented by a
i
(i = 0, 1, 2, ...,
86399). Then the bi-dimensional matrix is built with
86400 lines and N columns which must be
previously sorted and that will be represented by
M
ij
.
The algorithm used for the calculation of the
baseline (BLGBA) is based on a variation in the
calculation of mode, which takes the frequencies of
the underlying classes as well as the frequency of
the modal class into consideration. The calculation
takes the distribution of the elements in frequencies,
based on the difference between the greatest G
aj
and
the smallest S
aj
element of the sample, using only 5
classes. This difference divided by five, forms
the amplitude h between the classes, h = (G
aj
–
S
aj
)/5. Then the limits of each L
Ck
class are obtained.
They are calculated by L
Ck
= S
aj
+ h
*
k, where Ck
represents the k class (k = 1...5).
The proposal for the calculation of the baseline of
each Bl
i
second has the purpose of obtaining the
element that represents 80% of the analyzed
samples. The Bl
i
will be defined as the greatest
element inserted in class with accumulated
frequency equal or greater than 80 %. The purpose
is to obtain the element that would be above most
samples, respecting the limit of 80%. This process is
used for the generation of baselines models bl-7 and
bl-3.
The BLGBA model used for the calculation of
the baseline was chosen after the performance of
tests with other statistical models based on the mean,
octile, decile average and on the mode proposed by
Czuber. The choice for the BLGBA model was
based on:
1. Visual analysis of graphics containing the
baseline and its respective daily movement, as
illustrated in figure 4;
2. Deviation analysis proposed by Bland and
Altman (
Bland, 1986), takes into consideration
the differences between the predicted and
observed movements. Such differences must
lie between an interval defined by
sd ∗± 2 ,
where
d
is the differences mean and is the
standard deviation of these differences. With
this an upper and lower limit are set where the
deviation must be contained. The model that
presented better adjustment was the BLGBA,
with 95% of the differences in these limits;
s
3. Residual analysis – the model which showed
less residual index between the predicted and
the occurred movements was the BLGBA;
4. Linear regression (
Bussab, 2003) (Papouli,
2002) between the models aimed at evaluating
which one showed a better correlation
coefficient between the baseline and the daily
movement. Figure 2 shows the result of the
correlation tests for the segment S
1
related to
the months of September to November 2003.
In this figure it is possible to notice that the
BLGBA shows a better correlation coefficient
between the daily movement and the baseline.
The choice for the element that represents 80% of
the samples for the calculation of the baseline Bl
i
was done empirically. Analytical tests were carried
out through linear regression 00 using baseline with
this value ranging between 0 and 100%, with the
purpose of verifying if 80% would be the best value
to be used by the BLGBA, in the calculation of the
Bl
i
. Figure 3 shows the correlation coefficient R
between the baseline and the samples for values of
choice between 0 and 100 %. It is noticed that the
baseline that uses 80%, shows a better correlation
coefficient for BLGBA. These tests along with the
visual analysis of the graphics with baseline and
their respective daily movements showed that the
value of 80% for the calculation of the Bl was the
most satisfactory one
2.1 Baseline Results
The obtained results show the validity of the model
for the generation of the baseline, bearing in mind
the performed analyses and the comparison with the
real movement that occurred. An example of that
can be seen in figure 4 that illustrate in the form of a
histogram, the daily movement of the segment S
1,
and their respective baseline. In these figures some
graphs are shown, concerning the second week in
November 2003, with the baseline in blue and the
real movement that occurred on the day in green.
We came to the following conclusions with the
results shown in figures 4:
1. Clear peaks of traffic in the baseline
everyday between 0:30 and 4:00 o’clock in the
segment S
1
that are related to the backup
performed in this period in the network server;
2. The profile of traffic for the workdays,
figures 4 (a), generated by the bl-3 model and 4
(c), (d), (e), (f) and (g), generated by the bl-7
model, is quite similar with a strong time
dependence along the day which, in this case,
ICETE 2004 - SECURITY AND RELIABILITY IN INFORMATION SYSTEMS AND NETWORKS
156
is related to the working day hours of the
university where the tests were performed. In
the case of Saturdays and Sundays, the baseline
generated for these days are exactly the same
for bl-3 and bl-7 models, figures 4 (b), (h)
shows this results;
3. Not only the baseline generated for the
workdays bl-3 but also the one generated for
all the days of the week bl-7, showed to be
suitable for the characterization of the traffic.
The bl-7 is a model of baseline to be used in
cases in which there is the need to respect
individual particularities which occur in each
day of the week, such as backup days, whereas
the bl-3 is the most suitable for the cases where
this is not necessary, that is, all the workdays
can be dealt with in a single baseline, leaving
the decision on what model to be used to the
network manager’s;
4. Periods in which the traffic of the day
becomes higher than the baseline. In this case,
its color is changed from green to red, which
means a peak of traffic above the baseline, and
this could or could not be interpreted as an
alarm;
5. The generated baselines fulfill their main
objective which is the characterization of the
traffic in the analyzed segments;
6. The baseline is influenced by time factors
which, in this case, are related to the working
day that starts at 8:00 a.m. and finishes at
10:00 p.m.
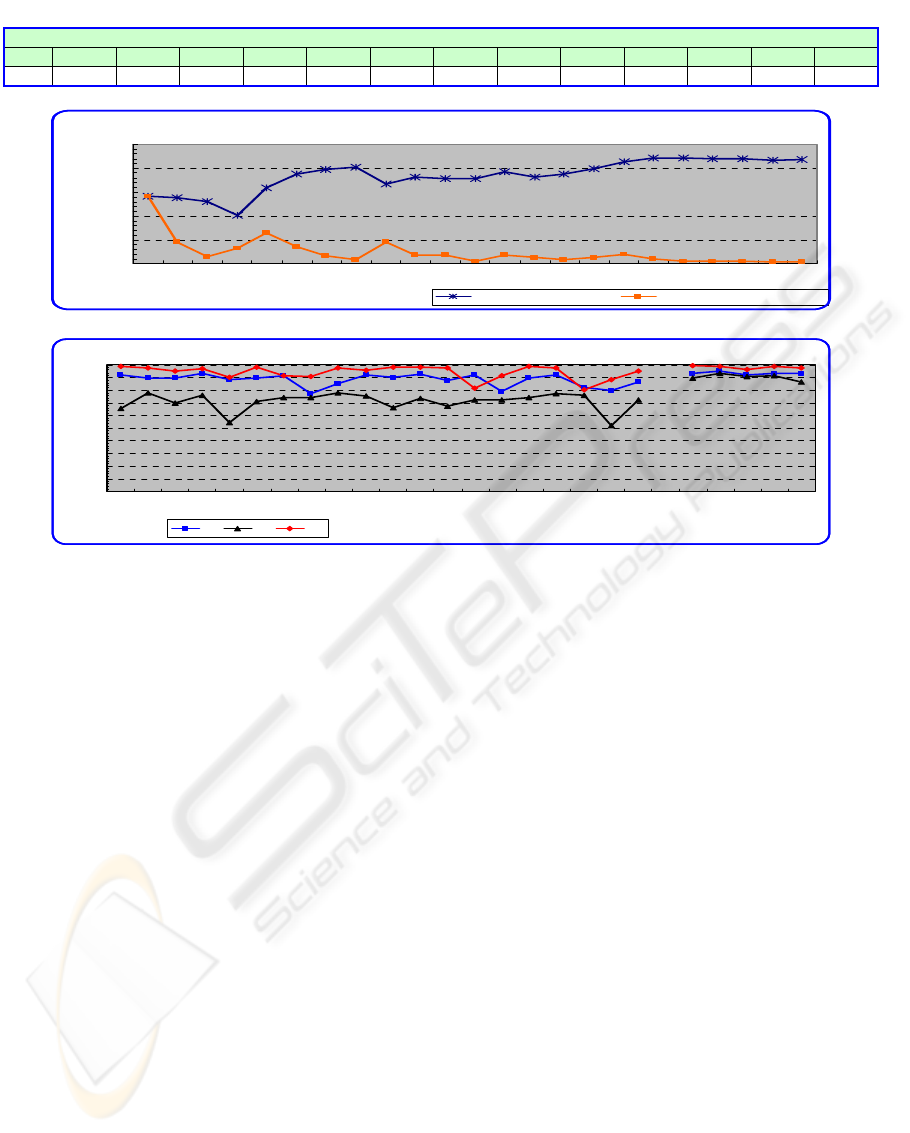
Table 1: Variation of the baseline from January 2003 to January 2004, for segment S
1
Jan/03 Fev/03 Mar/03 Apr/03 May/03 Jun/03 Jul/03 Aug/03 Sep/03 Oct/03 Nov/03 Dec/03 Jan/04
IVBL 1,10% 1,51% 5,38% 0,07% 8,66% 2,94% 5,83% 6,38% 4,95% 4,12% 2,78% 2,89% 3,02%
% of growth of the baseline/DSNS comparede with the previous month
Baseline varation index (IVBL)
0%
5%
10%
15%
20%
25%
1 2 3 4 5 6 7 8 9 10 11 12 13 14 15 16 17 18 19 20 21 22 23
Weeks
IVBL
N w eeks w ith 1 w eek
N w eeks w ith N-1 w eeks
Figure 5: % of variation of the baseline of n weeks compared to the (n – 1) weeks and 1 week.
BL-GBA linear regression at segments S1, S2 and S3 of November 2003
0.00
0.10
0.20
0.30
0.40
0.50
0.60
0.70
0.80
0.90
1.00
3
4
5
6
7
10
11
12
13
14
17
18
19
20
21
24
25
26
27
28
Monday
Tuesday
Wednesday
Thursday
Friday
days
Correlation (R)
S1
S2
S3
Figure 6: Analysis of the BLGBA by linear regression of November 2003.
7. The baselines presented in figures 4 were
generated by a 12 week sample collection of
real data in segment S
1.
Our studies have
demonstrated that for segments with a lot of
aggregate traffic as in S
1
and S
3
, 12 weeks is
necessary for a baseline formation.
Unfortunately, due to the limited quantity of
information that is presented in this article, it is not
possible to show other figures which corroborate
what was presented in this work. Nevertheless, at
the address http://gba.uel.br/blgba more information
and results obtained through this work can be found.
2.2 Baseline Evaluation
We created an index with the purpose of evaluating
the coefficient of variation of the baseline of one
month in relation to the other. This index is called
Index of Variation of the Baseline (IVBL). The
IVBL is calculated based on the difference between
one baseline and the other, as shown in equation (1).
With the IVBL it was possible to conclude that there
is usually a positive variation in the volume of
traffic from one month to the other, showing that
BASELINE TO HELP WITH NETWORK MANAGEMENT
157
despite being small, there is a tendency of growth in
the volume of traffic in the analyzed segments.
Table 1 shows the percentage of growth in the
segment S
1
from the network of UEL, from January
2003 to January 2004. In the other analyzed
segments, a small percentage of growth was also
observed.
86400'''
86400
1
⎟
⎠
⎞
⎜
⎝
⎛
−=
∑
=
i
i
i
BLBLIVBL
(1)
Where IVBL = variation index of a baseline in relation to another
The IVBL was also used to calculate the
variation of a baseline generated from n weeks and
compared to a baseline of (n - 1) weeks, and in the
comparison between the baseline of 1 week with the
baseline of n weeks. These calculations using
weekly baselines were carried out with the purpose
of evaluating and demonstrating the minimum
quantity of samples necessary for the formation of
the baseline. Initially it was concluded empirically
that it would be necessary 4 to 12 weeks for the
formation of the baseline. With the comparison of
the baseline of n weeks with the one of (n – 1),
during 24 weeks, it was observed that the percentage
of variation tends to stabilize from the 12
th
week on,
and not being significant for the formation of the
baseline. And when a baseline of 1 week was
established and a comparison was carried out for 24
weeks, it was also noticed that, from the 12
th
week
on, the percentage of variation tends to stabilize
around 20%, showing no more significant variations
that could be added to the baseline from this point
on. The figure 5 shows the results of these
comparisons.
Bland & Altman test - Segment S3
0
10
20
30
40
50
60
1 2 3 4 5 6 7 8 9 10111213141516171819202122232425262728293031
days
Number of errors
September
October
November Acceptable limit of errors (5%)
Bland & Altman test - Segment S2
0
10
20
30
40
50
60
12345678910111213141516171819202122232425262728293031
days
Number of errors
September
October
November Acceptable limit of errors (5%)
Bland & Altman test - Segment S1
0
10
20
30
40
50
60
12345678910111213141516171819202122232425262728293031
days
Number of errors
September
October
November Acceptable limit of errors (5%)
Figure 7: Bland & Altman test from September to November 2003 for segments S
1,
S
2
, and S
3
.
The Hurst parameter for segment S1 of november/2003 (Variance-time)
0.50
0.60
0.70
0.80
0.90
1.00
1.10
1
2
3
4
5
6
7
8
9
10
11
12
13
14
15
16
17
18
19
20
21
22
23
24
25
26
27
28
29
30
days
Hurst parameter
Var-time
BLGBA - Var-time
The Hurst parameter for segment S1 of november/2003 (Local Whittle)
0.50
0.60
0.70
0.80
0.90
1.00
1.10
1.20
1
2
3
4
5
6
7
8
9
10
11
12
13
14
15
16
17
18
19
20
21
22
23
24
25
26
27
28
29
30
days
Hurst parameter
Local Whittle
BLGBA - Local Whittle
The Hurst parameter for segment S1 of november/2003 (Periodogram)
0.50
0.60
0.70
0.80
0.90
1.00
1.10
1.20
1
2
3
4
5
6
7
8
9
10
11
12
13
14
15
16
17
18
19
20
21
22
23
24
25
26
27
28
29
30
days
Hurst parameter
Periodogram
BLGBA - Periodogram
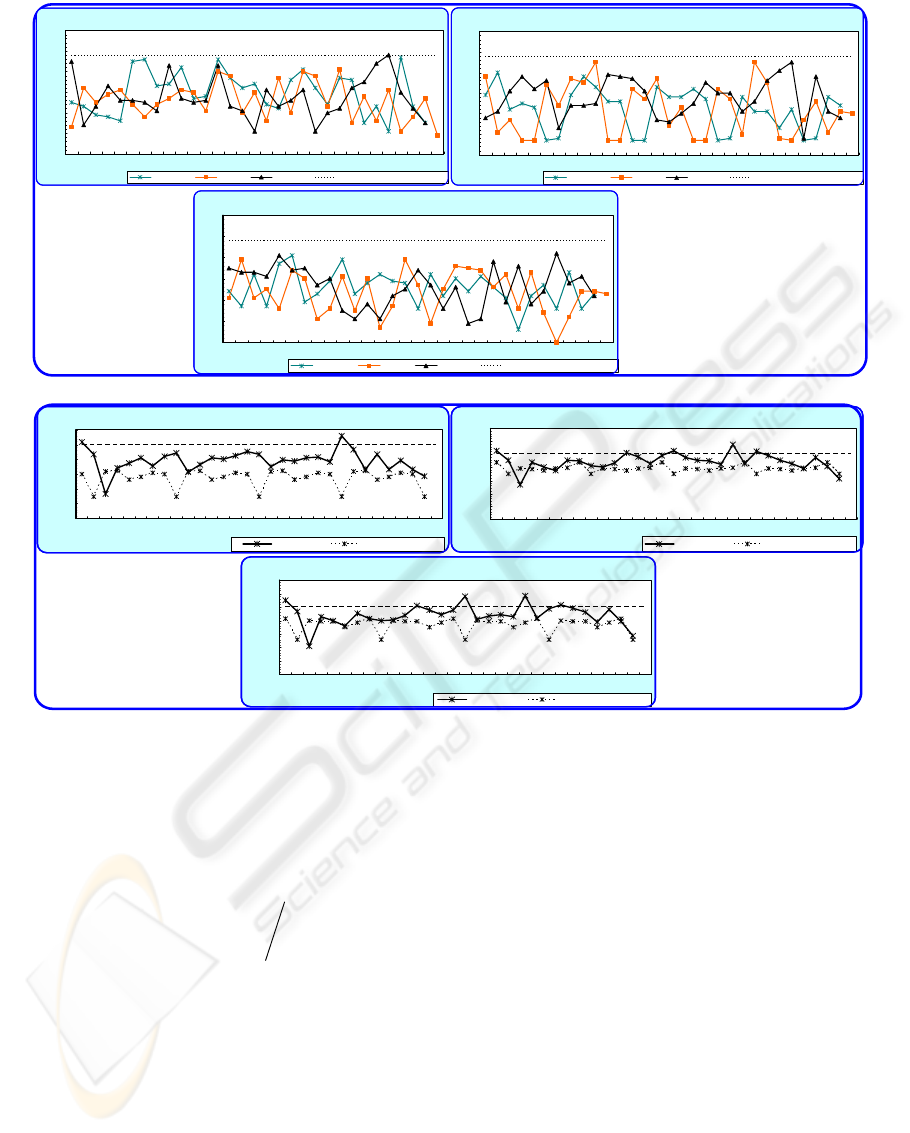
Figure 8: The Hurst Parameter for S
1
segment of November 2003.
Besides the visual evaluation of the results, other
analytical tests have been carried out aiming to
evaluate the reliability of the baseline generated by
the BLGBA in relation to the real movement. The
tests were carried out from January to November of
2003, below is presented a synthesis of the results:
I. Linear Regression (
Bussab, 2003) (Papoulis,
2002): Figure 6 presents the results of the
linear regression for the segments S
1,
S
2
, and S
3
ICETE 2004 - SECURITY AND RELIABILITY IN INFORMATION SYSTEMS AND NETWORKS
158

for all workdays of November of 2003. The
results demonstrate a high correlation and
adjustment between the movement that
occurred those days in relation to their
baseline;
II. Test purposed by Bland & Altman (Bland,
1986): Refer to the deviations analysis that
occur between the baseline and the real
movement. 95 % of the deviations/errors
observed during all days from September to
November 2003, in segments S
1,
S
2
, and S
3
, are
between the required limits of
sd ∗± 2
,
where
d
is the mean and
s
is the standard
deviation of the differences between the
baseline and the real movement, as shown in
figure 7. In the other months of the year the
results had also confirm the reliability of the
model, keeping 95 % of the cases inside the
limits established of
sd ∗± 2
;
III. Hurst parameter (H): Tests carried out with the
real movement and the baseline generated by
the BLGBA, using the statistical methods
Variance-time, Local Whittle and Periodogram
(Leland, 1994) generate the hurst parameter H.
The analysis confirms that the traffic is self-
similar and the baseline is also self-similar,
however presenting a lower hurst parameter.
Figure 8 illustrates an example of these
calculations for S
1
segment during November
2003. In most of the cases, these tests also
allow us to notice that in segments with lower
number of computers like S
2
, the hurst
parameter presents a lower rate between 0.6
and 0.7, in segments with great aggregated
traffic like the S
1
, and S
3
it presents a rate
between 0.8 and 1.0. The Hurst parameter
evaluation was made using the samples
collected second by second with the GBA tool.
Calculations were made for each day between
8:00 and 18:00 hours, the period when the
traffic is more similar to a stationary stochastic
process. Its utilization makes possible the
evaluation of the baseline quality in segments
of different burstiness. Indicating that the
greater the burstiness of the segment, the
bigger the Hurst parameter and the better the
characterization showed by the baseline. And
the lower the burstiness of the segment, the
smaller the Hurst parameter and worse the
results shown by the baseline. These results are
corroborated by the other tests utilized to
validate the baseline that also indicate an
increase of the baseline quality in segments
with a higher burstiness.
3 CONCLUSION
This work presented a contribution related to the
automatic generation of baseline for network
segments, which constitutes itself into an important
mechanism for the characterization of the traffic of
the analyzed segment, through thresholds that reflect
the real expectation of the volume of traffic
respecting the time characteristics along the day and
the week. This enables the network manager to
identify the limitations and the crucial points in the
network, control the use of the network resources,
establish the real use of the resources, besides
contributing to the planning of the needs and
demands along the backbone.
The use of an alarms system integrated to the
baseline as well as with the monitoring performed
real time by the GBA, figure 1 (b) and (c), can make
possible for the network manager to be informed
through messages, at the exact moment a difference
related to the expected traffic and the baseline, was
found out. This possibility is fundamental for the
segments or crucial points of the networks that
demand perfect control and pro-active management
in order to avoid the unavailability of the services
rendered.
The use of graphs such as the ones shown in
figures 4 with information about the baseline and
about the daily movement, makes a better control
over the segments possible.
It could be noticed that the behavior of the traffic
of the Ethernet networks is random, self-similar and
extremely influenced by the quantity of bursts,
which intensify as the number of hosts connected to
the segment increase, as shown in (Leland, 1994). It
also showed that the model chosen for the
characterization of the baseline, presented in this
work, is viable for the characterization of the traffic
in backbone segments that concentrate the traffic of
a great number of hosts, as shown in the examples
of section 2.
Tests were also realized with baselines from
other MIB objects, like ipInReceives, icmpInMsgs,
udpInDatagrams. The results have been satisfactory
and demonstrated that the BLGBA model can be
used for other MIB objects.
Besides the tests performed at the networks of
UEL and be initiate in the Communications
Department of the Electric Engineering Faculty of
UNICAMP, which results validating the model
BASELINE TO HELP WITH NETWORK MANAGEMENT
159

presented in this work, tests with different types of
networks, such as factories, large providers and
industries shall be performed, aiming to evaluate
and perfect the model proposed for generation of
baseline.
Another future work being developed refers to
the creation of a multiparametric model for alarms
generation aiming to aid the security, performance
and fault management, using a set of some
monitored objects baseline, such as IP, TCP, UDP
and ICMP packet traffic, traffic volume in bytes and
number of errors. The model consists in the
utilization of a baseline set, information about
possible network anomalies and rules for alarm
generation based on thresholds in differentiated
levels, which would indicate specific conditions to
customizable problems to the network. A creation of
an efficient mechanism of anomaly detection and
alarm generation is expected.
REFERENCES
Duffield, N.G.; Grossglauser, M. (2001, June) Trajectory
sampling for direct traffic observation;
Networking,
IEEE/ACM Transactions on, Volume: 9, Issue: 3,
Pages: 280 – 292.
Cabrera, J.B.D.; Lewis, L.; Xinzhou Qin; Wenke Lee;
Prasanth, R.K.; Ravichandran, B.; Mehra, R.K. (2001,
May);
Proactive detection of distributed denial of
service attacks using MIB traffic variables-a
feasibility study,
Integrated Network Management
Proceedings, IEEE/IFIP International Symposium on ,
Pages:609 – 622.
Northcutt, Stephen, Novak Judy. (2002) Network
Intrusion Detection, Third Edition, New Riders.
GBA, Ferramenta para Auxílio no Gerenciamento
Backbone Automatizado, Retrieved 03/05/2004 from
http://proenca.uel.br/gba/.
MRTG, The Multi Router Traffic Grapher , Retrieved
03/05/2004 from
http://people.ee.ethz.ch/~oetiker/webtools/mrtg/.
Rueda, A.; Kinsner (1996, May);
A survey of traffic
characterization techniques in telecommunication
networks,
Electrical and Computer Engineering,
Canadian Conference on, Vol.2, Pages:830-833.
Dilman, M.; Raz, D. (2002, May)
Efficient reactive
monitoring
Selected Areas in Communications, IEEE
Journal on, Vol.20, Iss.4, Pages:668-676.
Hajji, H. (2003, May);
Baselining network traffic and
online faults detection; Communications, ICC '03.
IEEE International Conference on, Volume: 1, 11-
Pages: 301 – 308.
Thottan, M.; Chuanyi Ji (2003, Aug);
Anomaly detection
in IP networks,
Signal Processing, IEEE Transactions
on Volume:51, Issue:8, Pages:2191–2204.
Papavassiliou, S.; Pace, M.; Zawadzki, A.; Ho, L. (2000,
June);
Implementing enhanced network maintenance
for transaction access services: tools and applications,
Communications, 2000. ICC 2000. IEEE International
Conference on, Volume: 1, 18-22, Pages: 211 - 215
vol.1.
Proença, Mario Lemes, Jr. (2001, September) "Uma
Experiência de Gerenciamento de Rede com
Backbone ATM através da Ferramenta GBA", Artigo
publicado no congresso, XIX Simpósio Brasileiro de
Telecomunicações – SBrT 2001, Fortaleza 03-
06/09/2001.
RFC-1213, INTERNET ENGINEERING TASK FORCE
(IETF) (1991, March) Management Information Base
for Network Management of TCP/IP-based internets:
MIB-II.
Bland J. Martin and Altman Douglas G. (1986), Statistical
Methods For Assessing Agreement Between Two
Methods of Clinical Measurement, The LANCET
i:307-310, February 8, 1986.
Bussab, Wilton O.; Morettin Pedro A. (2003) Estatística
Básica, Editora Saraiva, 5a edição.
Papoulis, Athanasios, Pillai S. Unnikrishna. (2002)
Probability, Random Variables and Stochastic
Processes, Fourth Edition, McGraw-Hill.
Leland Will E., Taqqu M. S., Willinger W., Wilson D. V.,
(1994) On the Self-Similar Nature of Ethernet Traffic
(Extended Version), IEEE/ACM Transactions on
Networking, volume 2, No 1, February 1994.
ICETE 2004 - SECURITY AND RELIABILITY IN INFORMATION SYSTEMS AND NETWORKS
160
